


Procedures
Please click on the boxes in the diagram below or use the menu on the left to go to the topic of your interest.

Chapter 23: Collecting woody perennials

Lars Schmidt
Forest Genetic Resources
Forest & Landscape, Denmark
Rolighedsvej 23
DK-1958 Frederiksberg C, Denmark
E-mail: lsc(at)life.ku.dk
|
2011 version |
1995 version |
||
|
Open the full chapter in PDF format by clicking on the icon above. |
|||
.jpg)
This chapter is a synthesis of new knowledge, procedures, best practices and references for collecting plant diversity since the publication of the 1995 volume Collecting Plant Diversity: Technical Guidelines, edited by Luigi Guarino, V. Ramanatha Rao and Robert Reid, and published by CAB International on behalf of the International Plant Genetic Resources Institute (IPGRI) (now Bioversity International), the Food and Agriculture Organization of the United Nations (FAO), the World Conservation Union (IUCN) and the United Nations Environment Programme (UNEP). The original text for Chapter 23: Collecting Woody Perennials, by the Forest Resources Division, Forestry Department, FAO (based on the work of L. Thomson), has been made available online courtesy of CABI. The 2011 update of the Technical Guidelines, edited by L. Guarino, V.
Ramanatha Rao and E. Goldberg, has been made available courtesy of Bioversity International.
Please send any comments on this chapter using the Comments feature at the bottom of this page. If you wish to contribute new content or references on the subject please do so here.
Back to list of chapters on collecting
Internet resources for this chapter
Abstract
 |
|
|
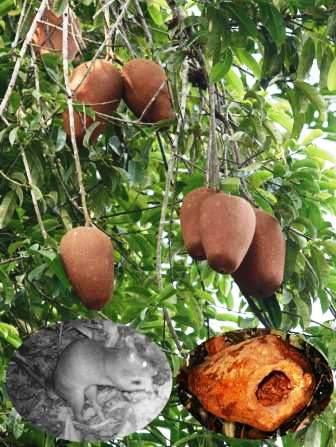
Allanblackia stuhlmannii, endemic to Eastern Arc Mountains in East Africa. Large fruits with recalcitrant seed. Seed collection is difficult because seed of fruits picked from the tree tend to have poor germinability. Awaiting natural fall yields better seed, but they must be collected fast as they are readily lost to giant rats who open the fruits and remove the seed. (Photo: Lars Schmidt, Tanzania 2010) |
There have been a number of changes during the decades since the establishment of the first commercial tree plantations. Seed propagation was formerly the principal mode of raising plantation stock, but now vegetative propagules in the form of rooted cuttings and tissue cultures are increasingly used. With the rapid decline in natural forests, especially in the tropics, potentially good sources of seed are becoming scarce, and seed collectors must often rely on scattered trees in farmlands or fragmented forest remnants, which are often degraded. These are the challenges of modern seed supply. The overall principles for collecting woody perennials, as written in the 1995 version of this chapter, are still valid, but improved access to technical equipment and information have modified many practices. Technically, seed collection has become easier, thanks primarily to technical developments outside the forest sector. Modern communication to the remotest areas of most countries has also helped, and GPS technology, satellite maps and computer databases have revolutionized the documentation process. In this revision of the 1995 chapter, we review collection methods and problems and look at the challenges ahead.
Introduction
The supply of forest seed has undergone a number of changes during the decades since the first commercial plantations were established. Where seed propagation was formerly the principal mode of raising plantation stock, vegetative propagules in the form of rooted cuttings and tissue cultures are now increasingly used for genetically improved material such as pines, eucalypts, casuarinas and Australian acacias (Beck and Dunlop 2001; Trueman 2006). On the other hand, planted trees can take a multitude of forms besides timber plantations, including plantations for biodiversity conservation, watershed protection, shelterbelts and other environmental plantings in addition to urban forestry and increased plantings on farmland for various agroforestry and landscape purposes. These latter categories typically include a wide variety of species for which seed is the common propagation method, but few of these species are established in seed orchards and most seed is collected from natural populations or farmlands.
With the rapid decline in natural forests, especially in the tropics, potentially good sources of seed are becoming scarce, and seed collectors must often rely on scattered trees in farmlands or fragmented forest remnants, which are often degraded. These are the challenges of modern seed supply. While the overall principles for collecting woody perennials, as written in the 1995 version of this chapter, are still valid, improved access to technical facilities and information have modified many practices. Technically, seed collection has become easier, thanks primarily to technical developments outside the forest sector. For example, the necessity for cleaning windows on tall buildings, pruning tall garden trees, etc., has made a multitude of extendable, telescopic and easy-to-assemble long-handled devices available in almost any hardware shop or building supplier around the world— tools that are indispensable for most seed collection from trees. Another example is the countless hours that have been spent on seed collection expeditions to potential seed sources, only to discover that seeds were not available either because of poor fruit set or bad timing. Modern communication to the remotest areas of most countries helps us avoid this problem, and GPS technology, satellite maps and computer databases have revolutionized the documentation process. Eventually, DNA technology, although still not available as a cheap pocket kit, will become indispensible for identifying genetic diversity and population structure, which are the very basics of genetic collection.
Desiccation-sensitive (recalcitrant) seeds still pose a problem in connection with both collection and storage; however, a great deal of systematic work on a wide range of species has showed ways to overcome the practical problems of short-term storage, which, in turn, enables us to get seed from collection to planting site with minimal loss.
Status
Genetic quality and seed source
Genetic quality is an important concern in almost all collecting of woody perennial seed. Traditionally, genetic quality refers to two things: ecotype (provenance) and the genetically dependent performance of the offspring of timber trees (for example, growth, straightness, wood quality, etc.). However, genetics influences all aspects of seed life, hence, also such characteristics as storability and health, which have traditionally been considered physiological aspects of seed quality. Diversity is therefore relevant to the collection of genetic resources as well as the breeding context, and genetic tests and trials, where available, may allow selection for genetic quality of desirable characteristics.
Individual trees may perform well under a range of ecological conditions. However, although there are many examples of species that perform well outside their natural range (and even under quite different conditions from their parents), it is still considered “safe” to match planting sites with seed sources from similar environments. Computer-based tools have made site-source matching much easier because a number of potentially limiting factors can be combined. Pioneering work was done in Australia on speciessite matching using climatic data (Booth et al. 1989). Later models have been extended to other countries, including other ecological data (e.g., soil), and used for provenance recommendations (Booth 1996, 1998).
Vegetation types, where described, are often a good indication of long-term suitability because they reflect long-term ecological interactions. For example, limiting factors for species growth may be recurrent intervals of disasters or stress factors such as typhoons, flooding, extreme drought, frost, hail storms or fires, which could be indicated by the types of vegetation growing in an area. Such risk factors are relevant for long-lived species like trees (VECEA 2012).
Seed sources refer to identified populations from which seed is collected; seed trees refer to the individual mother trees (Palmberg 1985). Seed sources have traditionally been classified according to their perceived genetic quality (secondary to the origin) or to establishment and management methods (Barner et al. 1988; OECD 1974). Natural forests are the base populations for seed supply, representing long-term adaptation to local conditions and high diversity. Sources of improved genetic material are various types of seed orchards, consisting of selected genetic material and managed for seed production. Plantations and seed production areas are considered improved sources, as compared to natural stands, because selection of individual seed trees is possible based on phenotype characters for highly heritable characteristics.
While categories of seed sources have been widely adopted in practical tree breeding and seed supply (Lantz 2008; Mulawarman et al. 2003), this classification system was developed for and is particularly suitable to traditional plantation species. It has limitations in connection with other planting types, especially agroforestry trees, which are often scattered. When used as seed sources, agroforestry trees or small populations of naturally occurring or planted trees are bulked during seed collection. Such “farmland seed sources” form a special category of increasing importance (Lillesø et al. 2011; Mbora et al. 2009).
Most forest trees are facultative out-breeding, but inbreeding (including selfing) often occurs and produces poor-quality seeds (Boshier 2000). This is no different from most other organisms, but it is a particular concern in forest trees because many wild seed sources consist of widely spaced, scattered trees where individual trees are functionally isolated from cross-pollination with other trees. For example, commercially valuable species such as Dalbergia, Afzelia, Pterocarpus, Xylia and hardwood dipterocarps in Indochina have been and still are subject to selective logging, implying that the distance between mature flowering individuals after logging is often several hundred meters and the probability of cross-pollination may be seriously reduced. Where natural forests remain relatively well protected, seed collectors might have problems obtaining permits for collecting.
Another risk of inbreeding has appeared in connection with the establishment of clonal plantations (e.g., from rooted cuttings or tissue culture). Individual members of clonal plantations are genetically identical, and crossing between ramets results in the same level of inbreeding as self-pollination. Clonally propagated casuarinas, eucalypts and acacias (including their species hybrids) are not only used in commercial plantations but are often indiscriminately distributed to farmers.
In planted seed sources (seed orchards), inbreeding is minimized by planting a high number of families or clones in a design that maximizes the distance between members of the same clonal group or family. Provenances should normally not be mixed for the following reasons: (a) they represent site adaptations (ecotypes) that are usually worth maintaining (cf. comments on site-source matching above), (b) genetic differences between provenances can cause out-breeding depression and (c) inherited phenological variation between provenances can result in asynchronous flowering, which could lead to restricted outbreeding and ultimately cause poor seed production and quality (Lyngdoh et al. 2010; Stacy 2001)
Time of collection
Seeds should be collected when they are mature (unless they can be after-ripened during processing) and before they are lost to dispersal, predation or germination. Problems connected to timing include the following:
-
Assessing the right maturation time: Some species undergo little visible change during maturation. Examples of maturation criteria are summarized in Schmidt (2000). Desiccation-tolerant species can often be after-ripened within the fruit after collection, since the major late maturation event is maturation drying (Berjak and Pammenter 1996, 2002). Desiccation-intolerant (recalcitrant) species pose a larger problem because they tend to undergo crucial development up to the time of dispersal. Only limited afterripening is possible, and collecting too early often results in poor germination (Berjak and Pammenter 1996, 2002).
-
Rapid dispersal of mature seed: Wind-dispersed seeds are often released very fast during dry windy conditions. Fruit-eating organisms tend to feed on fleshy fruits before they can easily be harvested by shaking, sometimes leaving little for the seed collector, particularly in relatively poor seed years.
-
Rapid germination of dispersed or shed seed: Seeds that do not undergo maturation drying (recalcitrant seeds) often germinate immediately after natural shedding under humid conditions; however, under wet conditions, even normally hard legume seeds can fail to develop their hard seed coat and germinate immediately (Schmidt 2000).
-
Pest attack: Seed beetles (such as bruchids in acacias) often attack seed immediately before maturity, when the seed coat is still relatively soft. Attacks can also occur after natural seed fall. For example, while the seeds of Allanblackia stuhlmannii in East Africa remain enclosed in the large fruits until natural fall, they are readily removed by rodents, sometimes the same night they fall.
For some species, collection time can be critical, since the time from maturation to dispersal, infestation or germination can be very short. Orthodox or desiccation-tolerant species are generally the easy ones, especially in dry fruits, since they often persist on trees for some time after maturation. Desiccationsensitive species, however, are problematic because maturation and germination are more or less continuous processes, allowing little time for seed collectors (Berjak and Pammenter 2002, 2003). The best general method for these species is to wait for natural fruit fall and proceed with pre-processing for temporary storage (see below).
Most humid tropical species exhibit some degrees of periodicity with masting and interim unproductive periods that can vary from one to several years. At the other extreme are species with almost always some seed but little at any given time. These seeds are typically in inconspicuous greenish fruits and are dispersed by specialized dispersal agents.
Collection method
Technically, collection methods have changed little over the last 20 years, but an increased focus on cost effectiveness and safety has influenced collection methods. Some crucial points to be considered in connection with any collection are the following:
-
Cost of alternative collection methods: Cost effectiveness involves using the cheapest and easiest method so long as it does not interfere with seed quality and human safety. Hence, if sound, good-quality seed can be collected from the ground under trees, and possible contaminants can be dealt with during seed processing, there is no need to attempt more difficult methods. If seed-bearing branches can be reached and pruned by long-handled tools, climbing might be unnecessary, etc. Note, however, that the efficiency of pollination can be different in different parts of the tree: a different part of the crown might have had different pollination exposure and therefore represent paternity diversity, whereas lower branches might contain a higher proportion of inbred seed (Patterson et al. 2001).
-
Seed accessibility: If seeds are physically out of reach (i.e., not on the ground and not reachable from the ground), tools and equipment must be used to collect them.
-
Availability of equipment and training: Each collection method needs special equipment: shooting requires a gun and ammunition, climbing needs climbing spurs, etc. In climbing, shooting or the use of mechanical equipment (such as mobile platforms) there is also an implicit demand for skills and training. Some general conditions can be listed that hold for any type of accessories: they must be safe for the user, lightweight, easy to clean, preferably collapsible or foldable, strong and durable, simple to operate and versatile (easy to adapt to other functions or species). It is not usually possible to drive a vehicle right to the seed tree, so equipment often needs to be carried. Specially designed bags that can be carried as backpacks or small all-terrain carts can take the place of several members of field staff and tough field work.
-
Further seed processing: The ease of extraction and cleaning can influence decisions on collection methods. Collecting seeds directly from the ground by raking or vacuuming will include a lot of debris, soil-borne pathogens and possibly other seed. This is not necessarily a problem as long as the seed can be cleaned and sorted afterwards and there is no debris that might harm the seed.
-
Physiological quality: Seed that is collected early might be immature; seed collected late can be infested by pests or pathogens; seed collected from the ground can deteriorate or germinate quickly, depending on the seed type and the environment on the forest floor.
-
Regulations, possible damage to trees and future crops: Protected areas often have strict regulations about damage to trees, which, in practice, might exclude most methods involving climbing. Collection using firearms can usually be done only by licensed staff.
-
Safety: Some trees cannot be climbed without risk: tall, large-diameter trees that fork into a few large horizontal branches at great height; trees in urban areas, which are frequently entangled in electric wires; trees that might be weakened by stem infections or inhabited by wasps, bees or other pesky creatures. The somewhat disappointing recommendation in all these examples is to stay down and away.
Three principal methods of seed collection are discussed below.
Collection from the ground
Ground collection is generally the simplest way to collect seed, and sometimes the only suitable method. However, it has some unavoidable limitations: (a) the exact identity of the mother tree cannot always be ascertained, especially in high-density stands, (b) seeds may be lost among the debris on the forest floor and (c) seeds might be infested by ground predators or pests, or they might germinate immediately after falling. Identifying maternity is usually only an issue in connection with individual tree breeding because population collections are bulked anyway. Loss, predation, infestation or fast germination can sometimes be prevented or reduced by placing ground cover, such as nets, tarpaulins or other devices that retain seeds below the trees (Karrfalt 2008)—provided that the seeds are not very small or light, or that wind is not a factor.
Ground collection with or without a ground cover inevitably involves pollution with debris like leaves, flower parts or soil, although most of the problems with pollution of seed lots has been overcome by the development of advanced seed-cleaning equipment and methods (Karrfalt 2008). The option of seed cleaning may even justify the use of rather “polluting” methods like vacuum collection or raking forest floors. The larger the seed, the easier it is to clean them. At least here many recalcitrant species have an advantage.
 |
|
|
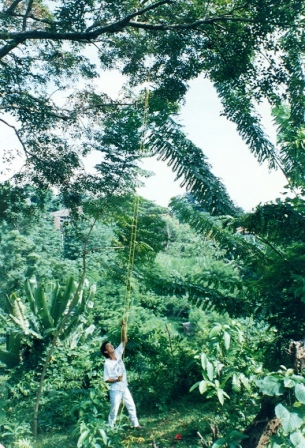
Cutting down fruit bearing branches by the help of a flexible saw is an old technique of seed collection. The saw is placed by advanced line technique e.g. a catapult, throw-bag, bow-and-arrow or the line. (Photo: Lars Schmidt, Philippines) |
|
 |
|
|
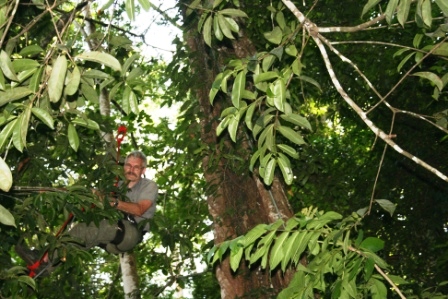
Modern tree climbing harnesses and ascending equipment are designed to be safe as well as convenient ‘working platforms’ during collection and other canopy work. |
Using long-handled tools
Long-handled tools may be used from the ground or any elevated structure like a car roof, ladder, or hydraulic lift, or during climbing. Most sectional and telescopic poles have a maximum length of about 3.5 to 4.5 meters, which is about the maximum for practical operation. Extended poles designed for tree work often have exchangeable tool heads, such as pruners, hooks and saws. There are even telescopic chain saws. Window cleaning has made a variety of telescopic poles available, which can be used for tree work. Most savannah-type trees and relatively exposed agroforestry trees with branches bearing low-hanging fruit can be reached with long-handled tools.
Climbing
Climbing is often inevitable in cases where the identity of the mother tree must be certain, where loss of seeds to predators or dispersal exclude collection from the ground, where fruits have not started to fall when the seed collection takes place, or where other factors exclude easier collection methods.
Climbing always implies a safety risk. Some trees cannot and should not be climbed under any circumstances, and many more should only be climbed by trained staff using advanced tree-climbing equipment. In general, the more secure the climber is, the more easily s/he can use hands and pay attention to fruit harvesting, and the more efficient s/he will be.
Ladders may be used up to a height of 5 to 10 meters. Again, thanks to the building industry, lightweight aluminium extension ladders are readily available in most parts of the world. Telescopic ladders with a maximum length of about 4 meters are becoming increasingly popular and thus available; they are both lightweight and easy to transport.
Taller trees are usually climbed with the help of climbing spurs (for details, see Blair 1995; Schmidt 2000, 2007; Stubsgaard 1997; Yeatman and Nieman 1978). Climbing spurs have remained relatively unchanged for decades. Modern safety belts (harnesses) have, probably thanks to various tree-climbing associations, become lightweight and much more comfortable than the old ones were (Anon. 1995; Blair, 1995). Comfort is especially important since belts serve not only as safety devices but also as working platforms during collection.
Most work in the canopy is done with a safety rope placed over a stout branch at a high point in the tree. Instead of the three-stranded ropes that were formerly used, most climbers now use braided ropes, which are both softer and lighter. The rope locks on ascenders make movement in the canopy easy and safe.
As an alternative to ascending via the bole (with spurs or ladders), the safety line may be placed directly over high branches by advanced line technique. Throw-lines and various ballistic devices may be used (see, for example, Gunn 2001; Schmidt 2000, 2007). Probably the most efficient is the so-called “big-shot”, which is a powerful catapult for line throwing. It is placed on the ground when in use and can shoot a small sandbag of about 150 grams about 25 meters up.
Advanced lines can also be used to place flexible pruning saws over individual branches that can be cut by alternately pulling the two lines of the saw. Shooting down high fruit-bearing branches is another technique to bringing down fruits without climbing (Gunn 2001). However, this technique has never really caught on outside of Australia, which may partly be because it is technically most suitable to very tall, small-seeded trees like eucalypts.
Temporary storage and transport
Temporary storage conditions during collection and transport can be crucial for maintenance of seed quality. The following aspects should be considered:
-
Potential deterioration: After collection, seed (a) might deteriorate physiologically due to adverse conditions such as high heat or excessive moisture, (b) might be attacked by pests or pathogens (pests covering anything from rats to insects, pathogens normally referring to bacteria and fungi that cause rot), or (c) might germinate. Germination only takes place at high moisture content and can, for desiccation-tolerant species, be prevented by drying. Pests and pathogens differ in their habit of attack. Sometimes they attack only soft moist material; sometimes the seed itself. Physiological deterioration means damage or death of essential seed cells or their components.
-
Conditions of seed or fruits at the time of collection: Moisture, high temperature and debris tend to aggravate decomposition.
-
Duration of temporary storage: Most types of deterioration work over time; hence, the longer the time from collection to processing, the higher the risk.
Moist fruits and seed respire and create heat, which accentuates deterioration. Proper ventilation is usually the best measure to prevent this. Moist seeds are more sensitive to temperature extremes than dry ones. Even short exposure to extremes can cause damage to sensitive recalcitrant seed. Accidentally high killing temperatures during transport can occur in a car boot under a tropical sun. During long transport time and distances pre-processing might be necessary in order to reduce bulk and prevent deterioration. For orthodox seed, deterioration is prevented by drying. For desiccation-sensitive seed, storage conditions are a delicate balance between preventing dehydration and allowing respiration to take place. Examples of temporary storage conditions for recalcitrant species are open or perforated plastic bags. From recent work on a wide range of desiccation-sensitive seed, the following general recommendations may be drawn (Berjak and Pammenter 2003; Sacandé et al. 2004):
-
Desiccation rate is often important: dry the seed as quickly as possible to the lowest safe moisture content (LSMC), which is variable between species and within species.
-
Keep the seeds under cool temperatures.
-
Sow the seeds as soon as possible.
Seed extraction
Seed extraction refers to the technique of physically removing seeds from their fruit or equivalent morphological covering. Extraction has several purposes: eliminating redundant bulk, separating individual seeds, removing easily decomposable fruit structures, eliminating fruit inhibitors or other dormancy structures, and removing potential sites for pest and disease attack. In some cases, extraction is necessary. In other cases, seed collectors may choose not to extract or only partly extract the seeds. Seeds of very thin-coated species (e.g., Cupressus, Pterocarpus) can easily be damaged during extraction, and it is often better to store them with their fruit covering intact.
Seeds of dehiscent dry fruits and cones are simply extracted by drying the fruits or cones and letting seeds fall out themselves, or sometimes with a bit of shaking or tumbling. Seed extraction from most dry dehiscent fruits and cones is very easy as long as the fruits and cones can be dried to a sufficiently low moisture content. Under adverse humid conditions and in the so-called serotinuous species (species with a large amount of resin or that open only under extreme conditions), special kiln or oven drying is necessary. Extraction procedures are described in ATCS (n.d.), Karrfalt (2008) and Schmidt (2000, 2007).
Seeds of some species tend to remain attached to the dry fruit covering after drying. This includes some cones and indehiscent dry fruits, such as some animal-dispersed acacias. Some wind-dispersed legumes also remain firmly attached to the split pod by a strong funicle. Such fruits need mechanical disintegration or splitting up of the entire fruit structure to separate the seeds (e.g., by mechanical threshing). In nuts and samaras, seed and fruits are dispersed as an entity, which cannot in practice be separated or separated only with great danger of damaging the seed.
Fleshy fruits like berries and drupes are usually extracted by wet extraction (e.g., washing and rubbing). Seeds of some species have fleshy attachments, typically an aril, while the seeds are enclosed in a dry fruit type, such as a follicle, pod or capsule. Magnolias and Australian acacias are examples of such species. Seeds must here be extracted in two rounds: first, a dry extraction in which fruits are dried to promote natural dehiscence and, second, a wet extraction where seeds are washed and rubbed to remove the fleshy aril. In the case of some acacias, the aril is relatively loosely attached to the seed and can be removed by dry tumbling with or without some abrasive material.
Species-wise collection and processing instructions
Collection and processing methods must be adjusted to species and environments. An attempt to describe and recommend procurement procedures for individual species occurs in the series of Seed Leaflets published by Forest&Landscape, Denmark (FLD) (http://sl.life.ku.dk/English/outreach_publications/reports/seed_leaflets.aspx). For Latin American species, see Vozzo (2002) (www.rngr.net/publications/ttsm). For the Pacific Islands, see Elevitch (2006) (www.traditionaltree.org) and Gunn et al. (2004).
Future challenges/needs/gaps
The main challenge to the supply of tree seed is providing high-quality seeds of priority species to end users, such as nursery and plantation owners or smallholders. The problem often starts with identifying and getting access to good-quality seed sources. For a number of species in the tropics, the quality of natural seed sources has been declining and there is a shortage of planted seed sources, not to mention field tests to prove or document genetic quality. For the majority of planted species, genetic tests are virtually absent and recommendations on quality often rely merely on speculations about site-source matching and diversity. Another complication, particularly for agroforestry trees, is that they are rarely assessed on their performance in intercropping. Since on-farm trials of trees are very difficult to monitor, the genetic quality of intercropped trees needs far more documentation.
A prerequisite for testing and documentation is that seed sources must be well defined and described. Few tropical countries have accessible, updated databases on seed sources, and there is encroachment on seed sources with the result that many seed sources now only exist on paper. Modern GPS and database technology, satellite maps and ease of communication should make such databases easy to document. There is a huge challenge to collect and update information nationally and on a global scale.
Tree size and the consequent area requirement make it virtually impossible to imagine a network of good seed sources, covering different ecotypes, for all species that will be planted in significant numbers. However, it would be feasible to include considerations for future seed sources in the criteria on conservation stands.
The mechanics of seed collection are not complicated if the seeds are there (the exception being some extremely tall forest trees, where canopies cannot be reached without great risk) and collectors have access to the necessary equipment. However, the cost of collecting plays a key role in the supply of seeds and an inevitable consequence is that many otherwise useful and interesting species are de facto deselected because of the cost of collecting the seed and the resulting lack of availability. There should be incentives to further rationalize seed procurement with the use of more efficient equipment. However, a key constraint for a number of lesser known species is the shortage of good seed sources and unpredictable seed production. For desiccation-sensitive seeds, in particular, it is not easy in seed-distribution and plantation systems to cope with irregular and unpredictable supplies. A major challenge would be to systematically record reproduction over many years and in this way develop a better prediction model, so that nurseries could take advantage of sudden masting. A more modest interim measure would be to record flowering, which precedes fruiting.
Although desiccation sensitivity is an innate species characteristic, the project initiated by the International Plant Genetic Resources Institute (IPGRI) and DANIDA Forest Seed Centre (DFSC) in 1995 carried out a systematic investigation of desiccation and storability behaviour—making a great leap forward in terms of adjusting processing and storage conditions to the need of individual species (Sacandé et al. 2004). The possibility of storing seed for a shorter period is a necessary buffer in seed procurement and supply. Or, from another angle, without the possibility of seed storage, the supply of a number species to a number of potential planters would be very difficult. Therefore, the aim should be to make optimal desiccation and storage protocols for as many species as possible (Thomsen 2000; Thomsen and Diklev 2000).
Seed supply and distribution systems need to be more efficient, especially for reaching smallholders. It is somehow ironic that the food-supply system has been able to establish the distribution of products like fruits and fish, while setting up a supply chain of forest seed has been extremely difficult. Among the many hurdles are the challenges of minimizing the monopolies of public enterprises, making guarantees for quality (physiological and genetic) and supplying relatively small quantities of seed.
The major challenges of future seed supplies are probably those connected to global and regional climate changes. Plant growers will have to adapt planting and, thus, selection of planting material according to predicted changes. This is likely to change the traditional 1:1 source-to-site matching. Instead, seed sources may be targeted in areas more prone to drought, flooding, wind or other adverse conditions to adjust for predicted changes in climate.
Changes in temperature, rainfall and wind patterns will inevitably influence vegetation zones and species requirements. Natural vegetation tends to indicate a long-term adaptation to prevailing climate, soil and other ecological conditions. For East Africa, for example, old vegetation maps have been used to predict species and provenance matching of forest trees. Digitalized versions of such maps may be used as a tool to match source and planting sites even under changed ecological and climatic conditions (VECEA 2012).
Back to list of chapters on collecting
References and further reading
Anon. 1995. A Guide to Good Climbing Practice. The Arboricultural Association, Stonehouse,UK.
Barner H, Olesen K, Wellendorf H. 1988. Classification and selection of seed sources. Lecture Note No. B-1. DANIDA Forest Seed Centre, Humlebaek, Denmark. Available online (accessed 21 June 2012): http://curis.ku.dk/portal-life/files/20656557/b1_001.pdf.
Beck SL, Dunlop RW. 2001. Micropropagation of the Acacia Species—A Review. In Vitro Cellular & Developmental Biology—Plant 37(5):531–538.
Berjak P, Pammenter NW. 1996. Recalcitrant (desiccation sensitive) seeds. In: Olesen K, editor. Innovations of Tropical Tree Seed Technology. Proceedings of the IUFRO Symposium of the Project Group P.2.04.00, “Seed problems”, Arusha, Tanzania, 7–10 September 1995. DANIDA Forest Seed Centre, Humlebaek, Denmark. pp 14-29. Available online (accessed 21 June 2012): www.iufro.org/download/file/3485/4376/20903-arusha1995-1_pdf.
Berjak P, Pammenter NW. 2002. Orthodox and recalcitrant seed. In: Vozzo J, editor. Tropical Tree Seed Manual. Agriculture Handbook 721. USDA Forest Service, Washington DC. pp 137-147. Available online (accessed 21 June 2012): www.rngr.net/publications/ttsm/ch4.
Berjak P, Pammenter NW. 2003. Understanding and handling desiccation-sensitive seeds. In: Smith RD, Dickie JB, Linington SH, Pritchard HW, Probert RJ, editors. Seed Conservation: Turning Science into Practice. Royal Botanic Gardens, Kew. pp.415–430. Available online (accessed 21 June 2012): www.kew.org/science-research-data/kew-in-depth/msbp/publications-data-resources/technical-resources/seed-conservation-science-practice/SCTSIP_chapter22.htm.
Blair DB. 1995. Arborist Equipment: A Guide to the Tools and Equipment of Tree Maintenance and Removal. International Society of Arboriculture, Champaign, IL.
Booth TH. 1996. Predicting plant growth: Where will it grow? How well will it grow? In: Proceedings of the Third International Conference/Workshop on Integrating GIS and Environmental Modeling, 21–25 January 1996, Santa Fe, New Mexico. National Center for Geographic Information and Analysis, Santa Barbara, CA. Available online (accessed 21 June 2012): www.ncgia.ucsb.edu/conf/SANTA_FE_CD-ROM/sf_papers/booth_trevor/booth.html.
Booth TH. 1998. A broadscale land evaluation program to assess the potential for growing particular trees in Africa. Agroforestry Systems 40(2):125–138.
Booth TH, Searle SD, Boland DJ. 1989. Bioclimatic analysis to assist provenance selection for trials. New Forest 3:225–234.
Boshier DH. 2000. Mating systems. In: Young A, Boshier DH, Boyle TJ, editors. Forest Conservation Genetics: Principles and Practice. CABI Publishing, Wallingford, UK. pp.63–79.
Elevitch CR, editor. 2006. Traditional Trees of Pacific Islands: Their Culture, Environment, and Use. Permanent Agriculture Resources. Holualoa, Hawaii. Individual chapters available online (accessed 26 June 2012): www.traditionaltree.org.
Gold K, León-Lobos P, Way MW. 2004. Manual de recolección de semillas de plantas silvestres. Boletín INIA 110. Instituto de Investigaciones Agropecuarias, La Serena, Chile. Available online (accessed 26 June 2012): www.kew.org/ucm/groups/public/documents/document/kppcont_028061.pdf.
Gunn B. 2001. Australian Tree Seed Centre Operations Manual. Australian Tree Seed Centre, Canberra. Available online (accessed 19 June 2012): www.csiro.au/Organisation-Structure/Divisions/Plant-Industry/~/media/CSIROau/Divisions/CSIRO%20Plant%20Industry/ATSCmanual_CPI_pdf%20Standard.pdf.
Gunn B, Agiwa A, Bosimbi D, Brammall B, Jarua L, Uwamariya A. 2004. Seed Handling and Propagation of Papua New Guinea’s Tree Species. CSIRO Forestry and Forest Products, Canberra.
Karrfalt RP. 2008. Seed harvesting and conditioning. In: USDA. The Woody Plant Seed Manual. Agriculture Handbook 727. United States Department of Agriculture, Forest Service, Washington DC. pp.57–83. Available online (accessed 26 June 2012): www.rngr.net/publications/wpsm/chapter3/at_download/file.
Lantz CW. 2008. Genetic improvement of forest trees. In: USDA. The Woody Plant Seed Manual. Agriculture Handbook 727. United States Department of Agriculture, Forest Service, Washington DC. pp.39–56. Available online (accessed 26 June 2012): www.rngr.net/publications/wpsm/chapter2/at_download/file.
Lillesø JBL, Graudal L, Moestrup S, Kjær ED, Kindt R, Mbora A, Dawson I, Muriuki J, Ræbild R, Jamnadass R. 2011. Innovation in input supply systems in smallholder agroforestry: Seed sources, supply chains and support systems. Agroforest Syst 83:347–359. Available online (accessed 26 June 2012): www.springerlink.com/content/v8v370k841282069/fulltext.pdf.
Lyngdoh N, Joshi G, Ravikanth G, Shaanker RU, Vasudeva R. 2010. Influence of levels of genetic diversity on fruit quality in teak (Tectona grandis L.f.). Current Science 99(5):639–643. Available online (accessed 26 June 2012): http://repository.ias.ac.in/55511/1/21_pub.pdf.
Mbora A, Barnekov Lillesø JP, Schmidt L, Angaine P, Meso M, Omondi W, Ahenda J, Mutua NA, Orwa C, Jamnadass R. 2009. Tree Seed Source Re-classification Manual. World Agroforestry Centre, Nairobi. Available online (accessed 26 June 2012): www.worldagroforestry.org/sites/default/files/Tree_Seed_source_classification_manual.pdf.
Mulawarman, Roshetko JM, Sasongko SM, Irianto D. 2003. Tree Seed Management—Seed Sources, Seed Collection and Seed Handling: A Field Manual for Field Workers and Farmers. TFRI Extension Series No. 152. International Centre for Research in Agroforestry and Winrock International, Bogor, Indonesia. Available online (accessed 19 June 2012): www.worldagroforestrycentre.org/SEA/Publications/Files/manual/MN0007-04.pdf.
OECD. 1974. Scheme for the Control of Forest Reproductive Material Moving in International Trade. Organisation for Economic Cooperation and Development, Paris.
Palmberg C. 1985. Sampling in seed collection. In: FAO. Forest Tree Improvement Forestry Paper 20. Food and Agriculture Organization of the United Nations, Rome. pp.41–45. Available online (accessed 26 June 2012): www.archive.org/stream/foresttreeimprov034656mbp/foresttreeimprov034656mbp_djvu.txt.
Patterson B, Vaillancourt RE, Potts BM. 2001. Eucalypt seed collectors: beware of sampling seedlots from low in the canopy. Australian Forester 64:139–142.
Sacandé M, Jøker D, Dulloo ME, Thomsen KA, editors. 2004. Comparative Storage Biology of Tropical Tree Seeds. Available online (accessed 26 June 2012): www2.bioversityinternational.org/publications/1032/.
Schmidt L. 2000. Guide to Handling of Tropical and Subtropical Forest Seed. DANIDA Forest Seed Centre, Humlebaek, Denmark. Individual chapters available online (accessed 26 June 2012): http://curis.ku.dk/portal-life/da/publications/guide-to-handling-of-tropical-and-subtropical-forest-seed(04448600-8813-11df-928f-000ea68e967b).html.
Schmidt L. 2007. Tropical Forest Seed. Springer Verlag, Berlin.
Stacy EA. 2001. Cross-fertility in two tropical tree species: Evidence of inbreeding depression within population and genetic divergence among populations. American Journal of Botany 88(6):1041–1051.
Stubsgaard F. 1997. Tree Climbing for Seed Collection, Techniques and Equipment. Technical Note No. 44. DANIDA Forest Seed Centre, Humlebaek, Denmark. Available online (accessed 26 June 2012): http://curis.ku.dk/portal-life/files/33049474/TN44.pdf.
Thomsen K. 2000. Handling of Desiccation and Temperature Sensitve Tree Seeds. Technical Note No. 56. ANIDA Forest Seed Centre, Humlebaek, Denmark. Available online (accessed 26 June 2012): http://curis.ku.dk/portal-life/files/20711281/technical_note_56.pdf.
Thomsen K, Diklev S. 2000, Laboratory Manual for Basic Tree Seed Studies. Technical Note No. 57. DANIDA Forest Seed Centre, Humlebaek, Denmark. Available online (accessed 26 June 2012): http://curis.ku.dk/portal-life/files/20711330/technical_note_57.pdf.
Trueman SJ. 2006. Clonal propagation and storage of subtropical pines in Queensland, Australia. The Southern African Forestry Journal 208(1):49–52.
USDA. 2008. The Woody Plant Seed Manual. Agriculture Handbook 727. United States Department of Agriculture, Forest Service, Washington DC. Available online (accessed 26 June 2012): http://www.rngr.net/publications/wpsm.
VECEA. 2012. Potential Natural Vegetation of Eastern Africa. Vegetation and climate change in Eastern Africa. Forest&Landscape, Denmark, Frederiksberg, Denmark. Seven-volume series available online (accessed 26 June 2012):. http://sl.life.ku.dk/English/outreach_publications/computerbased_tools/vegetation_climate_change_eastern_africa/series.aspx.
Vozzo JA, editor. 2002.Tropical Tree Seed Manual. USDA Agriculture Handbook 721. United States Department of Agriculture, Forest Service, Washington DC. Available online (accessed 26 June 2012): www.rngr.net/publications/ttsm.
Yeatman CW, Nieman TC. 1978. Safe Tree Climbing in Forest Management. Forestry Technical Report 24. Canadian Forestry Service, Ottawa. Re-issued as Safe Tree Climbing in Forest Management. Technical Note No. 24. DANIDA Forest Seed Centre, Humlebaek, Denmark.
Bonner FE, Vozzo JA, Elam WW, Land JSB. 1994. Tree Seed Technology Training Course. Instructor’s Manual. United States Department of Agriculture, Forest Service. Southern Forest Experiment Station. www.uri.edu/cels/ceoc/documents/TreeSeedTechnologyTrainingCourse-InstructorsManual.pdf.
DFSC/FLD. [Series of lecture notes, technical notes, research reports and the like pertaining to tree seed, seed sources and genetic improvement and conservation.] DANIDA Forest Seed Centre (now Forest&Landscape, Denmark), Humlebaek, Denmark. http://sl.life.ku.dk/English/outreach_publications/reports/publications_from_former_dfsc.aspx.
FLD. 2000+. Seed Leaflets. [Open-ended series of concise technical notes for individual species. By January 2012, the series contained about 155 publications on plantation, fruit and agroforestry species.] DANIDA Forest Seed Centre and Forest&Landscape, Denmark, Humlebaek, Denmark. http://sl.life.ku.dk/English/outreach_publications/reports/seed_leaflets.aspx.
Florabank guidelines for best practice for seed collection and use: www.florabank.org.au/default.asp?V_DOC_ID=755.
ICRAF/World Agroforestry Centre. Tree Seeds for Farmers: A Toolkit and Reference Source. www.worldagroforestry.org/sites/default/files/Toolkit.pdf.
ICRAF/World Agroforestry Centre. Agroforestree Database: www.icraf.org/resources/databases/agroforestree.
IUFRO. 1995. Innovations in Tropical Tree Seed Technology. Proceedings of the IUFRO Symposium of the Project Group P.2.04.00 “Seed Problems”, Arusha, Tanzania, 7–10 September 1995. www.iufro.org/download/file/3485/4376/20903-arusha1995-1_pdf.
Longman KA. 2003. Raising Seedlings of Tropical Trees. Tropical Trees: Propagation and Planting Manuals, Volume 2. Food and Agriculture Organization of the United Nations, Rome. www.fao.org/DOCREP/006/AD230E/AD230E00.HTM.
Smith RD, Dickie JB, Linington SH, Pritchard HW, Probert RJ, editors. 2003, Seed Conservation: Turning Science into Practice. Royal Botanic Gardens, Kew, UK. www.kew.org/science-research-data/kew-in-depth/msbp/publications-data-resources/technical-resources/seed-conservation-science-practice/index.htm.
Tree Planters Notes. 1950+. [Series of practical applied research reports pertaining to forest seed, nursery practice, plantation establishment and other tree plantings.] United States Department of Agriculture, Forest Service. Individual volumes available: www.rngr.net/publications/tpn.
USDA. 2008. The Woody Plant Seed Manual. Agriculture Handbook 727. United States Department of Agriculture, Forest Service, Washington DC. Individual chapters and entire manual available: www.rngr.net/publications/wpsm.
Willan RL. 1983. A Guide to Forest Seed Handling, with Special Reference to the Tropics. Food and Agriculture Organization of the United Nations, Rome. www.fao.org/DOCREP/006/AD232E/AD232E00.HTM.
In Spanish: http://www.fao.org/DOCREP/006/AD232S/AD232S00.HTM.
In French: http://www.fao.org/DOCREP/006/AD232F/AD232F00.HTM.
Organizations with documents of relevance to seed collection on the internet.
Arboricultural Association, Stonehouse,UK: www.trees.org.uk
Forest&Landscape, Denmark (FLD): http://sl.life.ku.dk/English.aspx
ICRAF/World Agroforestry Centre: www.worldagroforestrycentre.org
Millenium Seed Bank, Kew: www.kew.org/science-conservation/save-seed-prosper/millennium-seed-bank/index.htm
New England Tree Climbing Association: www.newenglandtreeclimbing.com
Sherriltree (tree-climbing equipment): www.sherrilltree.com
Tree Climbers International: http://treeclimbing.com
Tree Worker (UK) ((tree-climbing equipment): www.treeworker.co.uk
USDA Forest Service. Reforestation, Nurseries and Genetic Resources (RNGR): www.rngr.net
Chapter 4: Assessing the threat of genetic erosion
P. N. Mathur
Bioversity International Sub-Regional Office for South Asia
New Delhi, India
E-mail: p.mathur(at)cgiar.org
|
2011 version |
1995 version |
||
|
Open the full chapter in PDF format by clicking on the icon above. |
|||
This chapter is a synthesis of new knowledge, procedures, best practices and references for collecting plant diversity since the publication of the 1995 volume Collecting Plant Diversity: Technical Guidelines, edited by Luigi Guarino, V. Ramanatha Rao and Robert Reid, and published by CAB International on behalf of the International Plant Genetic Resources Institute (IPGRI) (now Bioversity International), the Food and Agriculture Organization of the United Nations (FAO), the World Conservation Union (IUCN) and the United Nations Environment Programme (UNEP). The original text for Chapter 4: Assessing the Threat of Genetic Erosion, authored by L. Guarino, has been made available online courtesy of CABI. The 2011 update of the Technical Guidelines, edited by L. Guarino, V. Ramanatha Rao and E. Goldberg, has been made available courtesy of Bioversity International.
Please send any comments on this chapter using the Comments feature at the bottom of this page. If you wish to contribute new content or references on the subject please do so here.
Back to list of chapters on collecting
Internet resources for this chapter
Abstract
The world community has confirmed its commitment to the conservation of plant genetic resources that provide valuable traits for meeting the challenges of the future, such as adapting crops to changing climatic conditions or disease outbreaks. However, this plant diversity is threatened by “genetic erosion”, a term coined by scientists for the loss of individual genes or combinations of genes, such as those found in locally adapted landraces. One of the main causes of genetic erosion is the replacement of local varieties by modern varieties. Other causes include environmental degradation, urbanization and land clearing through deforestation and bush fires. Genetic erosion can also occur on the level of germplasm collections and genebanks due to improper management and inadequate regeneration procedures. There is a need to strengthen the conservation and sustainable use of plants and seed systems, and the crucial linkages between them, through a combination of appropriate policies, use of scientific information, farmers’ knowledge, and action. Traditionally, efforts to counter genetic erosion have concentrated on conserving seeds in crop genebanks (ex situ). Today, it has become clear that the best strategy combines ex situ conservation with on-the-ground (in situ) conservation by farmers in their agro-ecosystems and of crop wild relatives in, for example, areas protected for their environmental value. While such mechanisms are vital, the sustainable use of plant genetic resources is likewise essential because plant genetic diversity increases options and provides insurance against future adverse conditions, such as extreme and variable environments. The threat of genetic erosion has been reported by many countries and is discussed in this chapter.
Current status
This chapter discusses the concept of genetic erosion in crops, defined as the loss of variation in crops due to the modernization of agriculture. Two stages leading to genetic erosion are recognized: the initial replacement of landraces by modern cultivars and further trends in diversity as a consequence of modern breeding practices. It may occur at three levels of integration: crop, variety and allele (Rogers 2004) and is often magnified or accelerated by human activities. In native plant populations, genetic erosion results from habitat loss and fragmentation, but it can also result from a narrow genetic base in the original collections or by practices that reduce genetic diversity. Although species-specific guidelines are not available, the risk of genetic erosion can be minimized by familiarity with the biology of the affected species (including breeding system, mode of reproduction and pattern of genetic diversity).
The loss of biological diversity has traditionally been measured by the frequency of species extinctions; however, genetic diversity does not only underlie species diversity—being concomitantly lost along with species extinctions—it has also been recognized in its own right as one of three levels of biological diversity recommended for conservation by the World Conservation Union (IUCN) (McNeely et al. 1990). Below, we review the different approaches to measuring genetic erosion in crops.
The first publicized use of the term “genetic erosion” was in reference to the loss of primitive races and varieties of cultivated plants as they were gradually replaced in agriculture with newer and more productive crop varieties. It was a topic of discussion in the international agricultural community in the mid-1900s and received prominence with the twin catastrophic outbreaks in 1970 of southern corn-leaf blight in the United States and of coffee rust in Brazil. These events illuminated the consequences of genetic erosion, stimulated international discussions and provided a major focus at the United Nations Conference on Human Environment in Stockholm in 1972 (Rogers 2004). The lesson was that “genetic uniformity is the basis of vulnerability to epidemics and, more generally, to biotic and abiotic stresses” (Scarascia-Mugnozza and Perrino 2002). Concerns about genetic erosion resulted in the initiation of a global network of genebanks to conserve agriculturally important genetic resources. In the agricultural sphere, there is ongoing concern and attention to genetic erosion at all levels, including the Food and Agriculture Organization of the United Nations (FAO).
Genetic erosion, or the steady loss of genetic diversity in on-farm agriculture, is perhaps the key pressure on the sustainable management of domesticated plant genetic resources (Brown and Brubaker 2002). Therefore, the term “genetic erosion” is now more generally applied to loss of genetic diversity, including the loss of diversity in native plant species. Also, the term “genetic erosion” is more often used in the context of human-driven or -related losses in genetic diversity that are faster in rate or larger in scale than would be expected under natural processes alone.
Genetic erosion has also been defined as “the loss of genetic diversity, in a particular location and over a particular period of time, including the loss of individual genes, and the loss of particular combinations of genes such as those manifested in landraces or varieties”. It is thus a function of change of genetic diversity over time. It is important to recognize that genetic erosion could be of two kinds: specifically, loss of alleles/genes, which can be noticed on farmers’ fields and in habitats of crop wild relatives and, more generally, the loss of entire genotypes, the landraces. It can also occur at another level: i.e., at the level of germplasm collections and genebanks due to improper management and inadequate regeneration procedures.
Monitoring changes in the rate of genetic erosion strictly requires directly comparable, if not identical, measures of the state of a system at several points in time. Alternatively, it is possible to measure the major agents of erosion (e.g., deterioration or destruction of habitat due to urbanization, land clearing, overgrazing, salinization, drought, climate change, etc.). However, such indirect measures are very broad and have other and possibly more profound impacts than causing loss of diversity (Brown 2008). Brown (2008) also suggests that neutral or trivial changes could mask critical changes when summed over loci, genotypes, populations or species. A temporal indicator should reveal and be most sensitive to the changes of concern and not be swamped by relatively unimportant changes. For example, the loss of a few alleles at a highly polymorphic microsatellite locus is likely to be of trivial or no importance compared with the loss of disease-resistance alleles. An additional problem lies in stressing combinations of alleles: in sexual species, all multilocus genotypes are unique and ephemeral. Thus, when a claim is made that some percentage of distinct clones or genotypes has been lost from a region or a species, this is not necessarily genetic erosion. The life of each genotype is finite in sexually reproduced species, although vegetative reproduction might prolong that life (such as in named cultivars of fruit trees). A reduction in population size, and not increased recombination, is the primary agent of erosion (Brown 2008).
The relationship between population size and loss of genetic diversity has been well established and quantified, with Wright’s (1931) work being seminal. Generally, smaller populations tend to lose genetic variation by genetic drift much more quickly than larger populations. And the shorter the generation length (that is, time to reproductive maturity), the more rapid the loss of diversity in absolute time (Frankham et al. 2004). There has been considerable theorizing and empirical research on the relationship between population size and genetic diversity (Ellstrand and Elam 1993; Falk and Holsinger 1991). This relationship has also been examined at the species level, and various reviews have found restricted or rare species generally less genetically diverse than more common plant species (Cole 2003; Gitzendanner and Soltis 2000; Hamrick and Godt 1990; Karron 1987, 1991). It is important to note, however, that there may be different processes underlying the relationship between genetic diversity and size in populations, as compared to species.
Genetic drift has a second consequence with a negative impact on genetic diversity. Simply put, smaller populations are more likely to have higher rates of inbreeding (Frankham et al. 2004).
For indicators of genetic erosion, it is more important to focus on the loss of genes or genotypes of concern within specified regions or production systems than to work with inclusive concepts and measures of the whole dynamics of diversity in the full geographic context. Fluctuations in the diversity of all rare gene combinations over time and in particular patches of a spatial distribution can be a distraction, unless they are indirectly measuring the loss of important components of the genome. Far more critical is the loss of highly localized alleles, locally adapted complexes or unique specific uses, if they cannot be replaced by a recombination of genes from other populations. Even if we had fully detailed inventories of genotypes in space and at two points in time, we would still require expert assessment of genepool changes in order to be in a position to speak about significant genetic erosion (Brown 2008).
Relevant measures of genetic erosion include some subjective assessments of the significance of any loss, based on expertise and local knowledge. The inclusion of such evaluative information in measuring erosion is desirable. The challenge is to format it in such a way that at least a tentative quantitative treatment is possible. The FAO survey and database of reported instances of genetic erosion has the potential to provide the basic information for constructing such a measure (Diulgheroff 2004). Many of the records so far assembled by FAO are in a descriptive, narrative style of local expert opinion; summarizing these stories over crops or regions or time periods requires converting them to quantitative estimates, which is a significant challenge. Therefore, we should adopt a retrospective procedure that can look back, where the researcher has before him/her a genepool containing some variation and asks the question as to what proportion of diversity that was known or assumed to have been present a decade ago remains. The estimate of what was previously extant should rely on as much evidence as possible. Initially, one could work with a richness concept of diversity. Alternatively a predictive or prospective procedure might be appropriate. In this case, two quantities would be essential for any reported instance:
1. A measure of the significance if the part of the genepool in question were to become extinct. This is approached by estimating the extent of the total diversity at risk, which could, in turn, be based on the area cultivated or the number of varieties or populations, using a factor of 0.20 as an estimate of the proportion of all diversity (in this case allelic richness) that is locally common (Brown and Hardner 2000). Suppose, for example, that 20% of the area or of the varieties are deemed to be at risk in a particular area. This amounts to 0.2 x 20% = 4% of the total genetic diversity in the crop imperilled in the area in question.
2. A category of the likelihood of loss under the current situation with no intervention (in some time period such as one decade). Classes: C = almost certain (p >90%), L = likely (p>50%), U = unlikely but threat still real (p<50%), V = very unlikely (p<10%). This might be affected by the area growing these varieties (Brown 2008).
Both these are subjective estimates but, ideally, could be based on local knowledge of the specific crop and threats to it. Any existing survey data could be used within this framework to support the estimates. While individual estimates and predictions may be prone to error, this framework is a way to codify the best opinion, and the averages will converge to give a trend. Finally, the predicted erosion can be estimated as the proportion of the resource under threat of erosion multiplied by the estimated probability of loss.
Future challenges/needs/gaps
Although there is undeniable evidence of the erosion of crop genetic diversity, and several innovative responses have been developed, there are important gaps in our knowledge that limit our capacity to decide among the various alternatives. Appropriate measures for diversity still need to be developed in order to better characterize the current situation and to evaluate changes in the future.
The capacity to evaluate genetic material in the laboratory is growing rapidly, but these are still expensive techniques, and more robust markers and measures are required to follow the progress of the conservation of genetic resources. When better measures of genetic diversity are devised, they will contribute to a clearer understanding of what exactly needs to be conserved.
Currently, there are only very general ideas about what portion of a plant population needs to be maintained in order to conserve particular genetic traits. This information is crucial to the efficient design of in situ conservation projects. More studies are also required to understand the causes of plant genetic erosion. Monitoring various putative causative factors is clearly one possible approach to assessing the risk of future genetic erosion within a genepool in a given area. However, the relationship between such factors and genetic erosion may not be straightforward. It might be non-linear and site-specific and might involve complex interactions among factors.
Once a past association between genetic erosion and different causative and countervailing factor(s) have been investigated in temporal and/or spatial comparisons, a predictive model could be constructed based on the assumptions that the association will continue into the future. Thus, a temporal comparison study could suggest that a particular factor might be responsible for genetic erosion in a particular genepool.
For agricultural crops, solutions or mitigations have focused on ex situ conservation: seed banks, genebanks, and others. This approach allows genetic diversity to be maintained even if it is not currently represented in agricultural practice. In addition, genetic research on some agriculturally important crops compares genetic diversity between modern and historic cultivars—and even with the progenitor wild plant species—where possible. This information helps to illuminate current or to predict future problems of genetic erosion, allowing an appropriate management response. For native plant species, the focus is on conservation of genetic diversity in situ, although ex situ conservation methods are certainly an appropriate parallel conservation strategy, particularly for rare or endangered species or those experiencing high mortality or rapid loss of habitat (Brown and Briggs 1991; Guerrant et al. 2004). However, ex situ conservation is not an effective or reasonable substitute for in situ conservation. These are complementary, rather than alternative, conservation strategies (Falk 1987; Given 1987). Ex situ collections, for example, are only a sample of the natural range of genetic diversity in the species. They are removed from the influence of natural selection and thus cannot accrue new adaptations over time. They are also vulnerable to financial constraints or downsizing, as well as chronic losses in diversity due to storage methods, catastrophic losses from equipment failures or fires, among other things (McGuire and Qualset 1990). Further, many of the world's genebanks do not meet minimum international standards for long-term storage, and most countries do not have facilities for the long-term storage and conservation of plant genetic resources. In a number of countries, genebanks are in a state of rapid deterioration; many accessions need to be regenerated and re-grown periodically in order to maintain seed quality. Avoiding losses of habitat or fragmentation of habitat are also important management practices (Rogers 2004).
Conclusions
Plant diversity is threatened by “genetic erosion”, a term coined by scientists for the loss of individual genes or combinations of genes, such as those found in locally adapted landraces. It is now well documented that over a period of time, there has been significant genetic erosion of crop diversity and there are several reasons for this loss. In Africa, the degradation and destruction of forests and bush lands is cited as a main cause of genetic erosion; overgrazing and over-exploitation are the reasons for the erosion of biodiversity in Cameroon, Burkina Faso, Guinea, Kenya, Morocco, Nigeria and Senegal, as well as in Saudi Arabia and Yemen in the Near East. Wars and civil strife have contributed to genetic erosion in Africa and Asia. In Latin America, most countries report major genetic erosion of economically important forest species.
More recently, the spread of modern, commercial agriculture and the introduction of new varieties of crops has been the main cause of the loss of genetic diversity (FAO 2012a). Considerable genetic uniformity now exists in a number of crops like hybrids of rice and sunflowers. Therefore, in many cases, it is still necessary to return to the store of genetic diversity, both ex situ and in situ, to find genes conferring resistance to biotic and abiotic stresses. The complementarity between seed conservation in genebanks (ex situ) and in ecosystems and natural habitats (in situ) should be further strengthened. Therefore, the FAO Second Global Plan of Action (FAO 2012b) also urges all countries to better manage crop diversity in farmers’ fields; develop strategies to protect, collect and conserve crop wild relatives and wild food plants that are under threat; support the use of a wider range of traits for plant breeding; and strengthen seed systems, especially those of locally adapted varieties. The main focus of the Second Global Plan of Action is to strengthen the conservation and sustainable use of plants and seed systems—and the crucial linkages between them—through a combination of appropriate policies, use of scientific information, farmers’ knowledge, and action. There is also an urgent need to develop improved indicators, including proxy indicators, of diversity, genetic erosion and vulnerability that can be used to establish national, regional and global baselines. These indicators should be objective and balanced, taking into account the systems in use at the national level. Local and indigenous knowledge should be recognized as an important component of surveys for assessing and inventorying genetic erosion and should be carefully considered and documented where appropriate.
Countries need to establish or strengthen systems for monitoring genetic erosion, including easy-to-use indicators. Support should be given to collecting farmers’ varieties/landraces in particularly vulnerable or threatened areas, where these are not already held ex situ, so that these genetic resources can be multiplied for immediate use and conserved for future use. National genebank collections should be duplicated outside the country (for example, in the genebanks of neighboring countries and/or in regional or international genebanks). In some countries, the threat of invasive alien species should also be considered, as these may contribute to genetic erosion. Since the loss of plant genetic resources for food and agriculture (PGRFA) varies within countries and from country to country, support should be provided to establish monitoring mechanisms at all levels. The World Information and Early Warning System on PGRFA (WIEWS) application for remote searching, updating and reporting on genetic erosion (http://apps3.fao.org/wiews/wiews.jsp) should be further strengthened.
Further research is needed (1) on the use of GIS technology to monitor genetic diversity and to predict and minimize genetic erosion and (2) on the incorporation of the resulting information into comprehensive information systems. Additional study is required in order to understand the nature and extent of possible threats to existing diversity on-farm and in situ. And further attention must be given to the many food crops that are the main staples for millions of the world's poor—like sorghum, millet, potatoes and cassava—which do not receive enough attention or investment in terms of conservation research and development.
Back to list of chapters on collecting
References and further reading
Brown AHD. 2008. Thematic background study on “Indicators of genetic diversity, genetic erosion and genetic vulnerability for plant genetic resources for food and agriculture”. A report submitted to FAO. Food and Agriculture Organization of the United Nations, Rome.
Brown AHD, Briggs JD. 1991. Sampling strategies for genetic variation in ex situ collections of endangered plant species. In: Falk D.A., Holsinger K.E., editors. Genetics and Conservation of Rare Plants. Oxford University Press, New York. pp. 99–119.
Brown AHD, Brubaker CL. 2002. Indicators of sustainable management of plant genetic resources: How well are we doing? In: Engels JMM, Ramanatha Rao V, Brown AHD, Jackson MT, editors. Managing Plant Genetic Diversity. CABI Publishing, Oxon, UK. pp. 249–262.
Brown AHD, Hardner CM. 2000. Sampling the gene pools of forest trees and ex situ conservation. In: Young A, Boyle TJB, Boshier D, editors. Forest Conservation Genetics Principles and Practices. CSIRO Publishing, Collingwood, Australia. pp. 185–196.
Cole CT. 2003. Genetic variation in rare and common plants. Annual Review of Ecology, Evolution, and Systematics 34:213–237.
Diulgheroff S. 2004. A global overview of assessing and monitoring genetic erosion of crop wild relatives and local varieties using WIEWS and other elements of the FAO global system of PGR. In: Ford-Lloyd BV, Dias SR, Bettencourt E, editors. Genetic Erosion and Pollution Assessment Methodologies. Proceedings of PGR Forum Workshop 5. Terceira Island, Autonomous Region of the Azores, Portugal, 8–11 September 2004. Bioversity International, Rome. pp. 6–14.
Ellstrand NC, Elam DR. 1993. Population genetic consequences of small population size: Implications for plant conservation. Annual Review of Ecology and Systematics 24:217–242.
Falk DA. 1987. Integrated conservation strategies for endangered plants. Natural Areas Journal 7:118–123.
Falk DA, Holsinger KE, editors. 1991. Genetics and Conservation of Rare Plants. Oxford University Press, New York.
FAO. 2008. Erosion of plant genetic diversity. FAO Newsroom. Food and Agriculture Organization of the United Nations, Rome. Available online (accessed 12 June): www.fao.org/newsroom/en/focus/2004/51102/article_51107en.html.
FAO. 2012a. The Second Report on the State of the World’s Plant Genetic Resources. Food and Agriculture Organization of the United Nations, Rome. Available online (accessed 12 June 2012): www.fao.org/agriculture/crops/core-themes/theme/seeds-pgr/sow/sow2/en.
FAO. 2012b. AGP—Updating the Global Plan of Action. Food and Agriculture Organization of the United Nations, Rome. Available online (accessed 12 June 2012): www.fao.org/agriculture/crops/core-themes/theme/seeds-pgr/gpa/gpa_update/en.
FAO. 2012c. FAO moves to halt plant genetic erosion. FAO Media Centre. Food and Agriculture Organization of the United Nations, Rome. Available online (accessed 12 June 2012): www.fao.org/news/story/en/item/113740/icode.
Frankham R, Ballou JD, Briscoe DA. 2004. A Primer of Conservation Genetics. Cambridge University Press, Cambridge, UK.
Gitzendanner MA, Soltis PS. 2000. Patterns of variation in rare and widespread plant congeners. American Journal of Botany 87:783–792.
Given DR. 1987. What the conservationist requires of ex situ collections. In: Branwell D, Hamann O, Heywood V, Synge H, editors. Botanic Gardens and the World Conservation Strategy. Academic Press, London. pp. 103–116.
Guarino L. n.d. Approaches to Measuring Genetic Erosion. International Plant Genetic Resources Institute, Rome. Available online (accessed 12 June 2012): http://apps3.fao.org/wiews/Prague/Paper3.jsp.
Guerrant EO, Havens K, Maunder M, editors. 2004. Ex Situ Plant Conservation: Supporting Species Survival in the Wild. Island Press, Washington DC.
Hamrick JL, Godt MJW. 1990. Allozyme diversity in plant species. In: Brown AHD, Clegg MT, Kahler AL, Weir BS, editors. Plant Population Genetics, Breeding, and Genetic Resources. Sinauer, Sunderland, MA. pp. 43–63.
Karron JD. 1987. A comparison of levels of genetic polymorphism and self-compatibility in geographically restricted and widespread plant congeners. Evolution and Ecology 1:47–58.
Karron JD. 1991. Patterns of genetic variation and breeding systems in rare plant species. In: Falk DA, Holsinger KE, editors. Genetics and Conservation of Rare Plants. Oxford University Press, New York. pp. 87–98.
McGuire PE, Qualset CO, editors. 1990. Genetic Resources at Risk: Scientific Issues, Technologies, and Funding Policies. Report No. 5. Genetic Resources Conservation Program, University of California, Davis, CA.
McNeely JA, Miller KR, Reid WV, Mittermeier RA, Werner TB. 1990. Conserving the World’s Biological Diversity. World Conservation Union, World Resources Institute, Conservation International, World Wildlife Fund-US, and the World Bank, Washington DC.
Rogers DL. 2004. Genetic erosion: No longer just an agricultural issue. Native Plants (Fall) 2004:113–122. Available online (accessed 12 June 2012): www.nativeplantnetwork.org/Content/Articles/5-2NPJ112-122.pdf.
Scarascia-Mugnozza GT, Perrino P. 2002. The history of ex situ conservation and use of plant genetic resources. In: Engels JMM, Ramanatha Rao V, Brown AHD, Jackson MT, editors. Managing Plant Genetic Diversity. CABI Publishing, Oxon, UK. pp. 1–22.
Wright S. 1931. Evolution in Mendelian Populations. Genetics 16:97–159.
Commission on Genetic Resources for Food and Agriculture: www.fao.org/nr/cgrfa
World Information and Early Warning System on PGRFA (WIEWS): http://apps3.fao.org/wiews/wiews.jsp
Chapter 14: Ecogeographic surveys
N. P. Castañeda Álvarez
International Center for Tropical Agriculture (CIAT) - Bioversity International
Cali, Colombia and
School of Biosciences, University of Birmingham,
Edgbaston, Birmingham, UK
E-mail: n.p.castaneda(at)cgiar.org
H. A. Vincent
School of Biosciences, University of Birmingham,
Edgbaston, Birmingham, UK
E-mail: holly.vincent(at)gmail.com
S. P. Kell
School of Biosciences, University of Birmingham,
Edgbaston, Birmingham, UK
E-mail: s.p.kell(at)bham.ac.uk
R. J. Eastwood
Millennium Seed Bank Seed Conservation Department, Royal Botanic Gardens
Kew, UK
E-mail: r.eastwood(at)kew.org
N. Maxted
School of Biosciences, University of Birmingham,
Edgbaston, Birmingham, UK
E-mail: n.maxted(at)bham.ac.uk
|
2011 version |
1995 version |
||
|
Open the full chapter in PDF format by clicking on the icon above. |
|||
This chapter is a synthesis of new knowledge, procedures, best practices and references for collecting plant diversity since the publication of the 1995 volume Collecting Plant Diversity: Technical Guidelines, edited by Luigi Guarino, V. Ramanatha Rao and Robert Reid, and published by CAB International on behalf of the International Plant Genetic Resources Institute (IPGRI) (now Bioversity International), the Food and Agriculture Organization of the United Nations (FAO), the World Conservation Union (IUCN) and the United Nations Environment Programme (UNEP). The original text for Chapter 14: Ecographic Surveys, authored by N. Maxted, M. W. van Slageren and J. R. Rihan, has been made available online courtesy of CABI. The 2011 update of the Technical Guidelines, edited by L. Guarino, V. Ramanatha Rao and E. Goldberg, has been made available courtesy of Bioversity International..
Please send any comments on this chapter using the Comments feature at the bottom of this page. If you wish to contribute new content or references on the subject please do so here.
Back to list of chapters on collecting
Internet resources for this chapter
 |
|
|
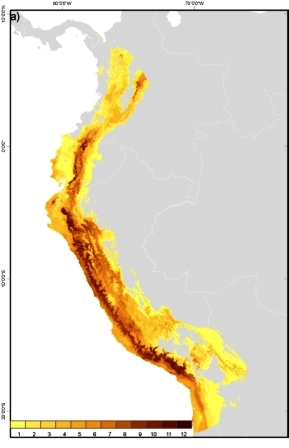
Tomato (Solanum lycopersicum L.) wild relatives potential richness map. This maps depicts the number of taxa that are potentially found per unit of area. Darker colours represent greater richness of the tomato genepool. (Map by N. P. Castañeda Álvarez/May 2012) |
Abstract
Since the completion of the original version of this chapter, even greater emphasis has been placed on the conservation and exploitation of the broader crop genepool and, as such, ecogeography remains a critical tool in formulating effective and efficient conservation strategies, although, increasingly, ecogeographic surveys are seen as an element within a more comprehensive systematic gap analysis (see chapter 41 in the 2011 version of these Technical Guidelines). However, ecogeographic techniques themselves have advanced significantly since the 1995 chapter on ecogeographic surveys, particularly in terms of information availability and management. Most notably, the affordability in terms of cost, timing and resolution of geographical information systems (GIS), as well as the improvement in (and lower costs for acquiring) hardware and software, now makes ecogeographic analysis a routine task for the agrobiodiversity conservationist. In this updated chapter on ecogeographic surveys, ecogeography itself is redefined and the relationship between ecogeography and gap analysis is reviewed. Progress in the current status of nine key areas is examined: (1) selection of target taxa, (2) ecogeographic database standards, (3) ecogeographic data availability, (4) collection methods for ecogeographic data, (5) on-line gazetteers, (6) threat assessment, (7) GIS analysis and prediction, (8) assessing the impact of climate change and (9) germplasm use. There have been significant advances in ecogeographic techniques in recent years, they remain critical to the conservation and utilization of plant genetic resources.
Introduction
The 1995 chapter starts with the statement that “plant collectors are like detectives: they gather and analyse clues in order to trace plants of interest.” This statement remains essentially as true today as it was in 1995 when the original text was compiled, although technically, today we may wish to stress more the tracing of genetic diversity within the broader crop genepool. Conservationists do not just look randomly for the diversity they are targeting; the planning and targeting of conservation is associated with careful preparation to identify where to sample germplasm, where to establish genetic reserves, and how precisely the resource will be conserved and later used. Essentially, ecogeographic surveys use historic provenance and population data as a basis for planning and targeting future conservation: past data are predictive. For example, given the requirement to conserve the perennial wild relative of garden peas Vavilovia formosa (Steven) Fed., we know that this species has historically always been found growing on limestone scree slopes above 2000 metres in Southwest Asia, so this is the habitat and location where we can expect to be able to collect germplasm for ex situ conservation or to conserve it in situ today. Although having made this simple point, it must be admitted that there are areas of the world that remain under-surveyed even today (such as eastern Turkey and the Democratic Republic of the Congo), and so past data are imperfect. But here we can use predictive modelling based on the available historic data to more effectively plan and implement conservation.
Soon after publication of the original chapter, it was clear that the definition of ecogeography needed to be amended; therefore, it is good to have the opportunity here to revise the definition. The first limitation was that the definition implied that only ecological, geographical and taxonomic information was used, but anyone that has undertaken an ecogeographic survey or study will know that knowledge of the pattern of genetic diversity for the target taxon is equally relevant to conservation planning. Given the conservation goal of maximizing genetic diversity, it could be argued that without full consideration of patterns of genetic diversity (where they are known), information based on ecological, geographical and taxonomic evidence could be misleading and could waste scarce conservation resources. The second problem with the definition is the separation of collection from broader conservation. It is now universally accepted that the application of in situ and ex situ techniques are necessary and complementary, the one providing (among other benefits) a security back-up for the other. The collation and analysis of ecogeographic data is an equally critical precursor for effective ex situ and in situ conservation, so both conservation strategies deserve equal weight in the definition. Therefore, the following revision of the definition of ecogeography is proposed:
Ecogeography is a process of gathering and synthesizing information on ecological, geographical, taxonomic and genetic diversity. The results are predictive and can be used to assist in the formulation of complementary in situ and ex situ conservation priorities.
When the 1995 text was prepared, there was already extensive literature on “gap analysis” (i.e., how to identify areas in which selected elements of biodiversity are underrepresented, e.g., see Margules 1989). This body of literature has continued to be extended (i.e., Balmford 2003; Brooks et al. 2004; Dietz and Czech 2005; Margules and Pressey 2000; Riemann and Ezcurra 2005). This literature was originally applied to indigenous forests, particularly on small islands rich in endemic species. However, Maxted et al. (2008) showed how the existing methodology might be adapted for more general conservation and proposed a specific methodology for the genetic gap analysis of crop wild relatives (CWR), which involves four steps: (a) identify priority taxa, (b) identify ecogeographic breadth and complementary hotspots using genetic diversity, distribution and environmental data, (c) match current in situ and ex situ conservation activities with the identified genetic diversity, ecogeographic breadth and complementary hotspots to identify the so-called conservation “gaps” and (d) formulate a revised in situ and ex situ conservation strategy. Gap analysis has rapidly established itself as the methodology for conservation planning (FAO 2009; Parra-Quijano et al. 2011; Ramírez-Villegas et al. 2010), not replacing ecogeography, but in reality subsuming ecogeography as an element within the gap analysis protocol. As such, ecogeographic surveys will continue to be routinely undertaken, but increasingly within a gap analysis context. Therefore, an additional chapter (Chapter 41 entitled “Gap Analysis: A Tool for Genetic Conservation”) has been added to these Guidelines, which reviews the gap analysis methodology. It should be seen as a sister chapter to read in conjunction with this chapter.
Current status
Although ecogeographic surveys are a necessary precursor to the conservation of both crop and wild plants, the increasing interest in the conservation and use of CWR diversity means that the techniques used to collate ecogeographic data have advanced significantly since 1995, most notably in the methods of data collation and subsequent analysis. The use of ecogeographic techniques for crop and wild-plant diversity was thoroughly reviewed by Guarino et al. (2006) and for crop wild relatives by Maxted and Guarino (2003). The following is a review of the major innovations since the original text was published in 1995, demonstrating the continuing value of ecogeographic techniques and the novel opportunities and challenges they offer for the conservationist.
Selection of target taxa
Any conservation action requires a clear target and, as mentioned in the 1995 text, this may be established in the project commission, but the recent creation of a global priority checklist of CWR taxa (Vincent et al., 2012; www.cwrdiversity.org/home/checklist) should assist conservation planning by having a pre-existing prioritizing list of priority taxa for the major and minor crops of the world. It is referred to as the Harlan and de Wet Global Priority Checklist to acknowledge the pioneering work of Harlan and de Wet (1971) in first proposing the Gene Pool (GP) concept to explain the relative value of species in their potential as gene donors for crop improvement. The database contains background information on 174 crop genepools and 1397 priority CWR species: those deemed priority CWRs as defined by their membership in GP1b or GP2, or Taxon Groups (TG) 1b, 2 or 3. There are also a limited number of GP3 and TG4 taxa included if they have previously been shown to be useful in breeding. The Gene Pool concept designated the crop itself as GP1a, while GP1b are the wild or weedy forms of the crop that cross easily with it. GP2 are secondary wild relatives (less closely related species from which gene transfer to the crop is possible but difficult using conventional breeding techniques), and GP3 are tertiary wild relatives (species from which gene transfer to the crop is impossible, or if possible, requires more advanced techniques, such as embryo rescue, somatic fusion or genetic engineering).
If the necessary crossability information is lacking, as it is for most crop genepools, then the taxon group concept (Maxted et al. 2006) can substitute for the genepool concept. The taxon group concept employs the taxonomic hierarchy as a proxy for taxon genetic relatedness and thus crossability, so TG1a is the crop, TG1b is the same species as the crop, TG2 is the same series or section as the crop, TG3 is the same subgenus as the crop, and TG4 is the same genus. The assumption is that the taxonomic classification is related to crossability, and if genepool and taxon group concepts are compared for those crop genepools where a genepool concept is known, this assumption seems well founded. The data recorded in the database for each crop include the associated published genepool concept or taxon group concept, complete with references, and confirmed and potential CWR taxa used in crop breeding and improvement. Then, for each taxon (including crop taxa) the following information is recorded: accepted name (standardized to the Plant List, www.theplantlist.org), taxonomic classification, common name, main synonyms, seed storage behaviour, geographic distribution, key herbaria holding specimens (derived from geographic distribution) and utilization data with references. It is expected that the checklist will be dynamic in that as new genepool or taxon group concepts are published, authors will be able to upload their concept to the online database and make it readily available to the user community. It will act as a guide to those establishing geographical and genepool CWR conservation priorities in individual countries or crops.
Ecogeographic database standards
Ecogeographic data, in part, describe the population location and, therefore, the ecology and environment where particular taxa may occur. It is common for these data to be organized under different standards, data structures and file formats, usually capturing different sorts of details. Thus, when merging ecogeographic information taken from different sources, attention is needed to combine similar information correctly and avoid combinations that might lead to mistakes or data loss.
Increasingly, global efforts to standardize biological information have promoted standards to improve the recording and exchange of data within databases. The Taxonomic Databases Working Group (TDWG) (www.tdwg.org) is one of the main initiatives for developing and promoting standards that enable the exchange of biological records. The current standard recommended by TDWG for biological records is the “Darwin Core” (http://rs.tdwg.org/dwc/index.htm). The standard “Access to Biological Collection Data” (http://wiki.tdwg.org/twiki/bin/view/ABCD/AbcdIntroduction) is also recommended; however, it does not comply with all the specifications of the working group. Alternative systems to organize, store and distribute biological information are also available. Botanical Records and Herbarium Management (BRAHMS) (http://dps.plants.ox.ac.uk/bol/brahms/Home/Index) is a well-known system, focused on herbaria, living collections and seed-bank data that enables users to manage, analyse and share their data.
Despite the relative diversity of standards available, interoperability between standards is becoming common, allowing data repositories to gather information and benefiting users who require access to biological records.
Online ecogeographic data availability
Perhaps one of the key changes between 1995 and today is the exponential growth of web-enabled ecogeographic datasets, most notably the Global Biodiversity Information Facility (GBIF) established in 2001 (http://data.gbif.org), which provides extensive access to global taxon nomenclature, taxon and accession distribution, conservation and environmental data. Established to encourage free and open access to biodiversity data via the internet and now encompassing a network of 57 countries and 47 organizations, GBIF promotes and facilitates the mobilization, access, discovery and use of information about the occurrence of organisms over time and across the planet. It facilitates the digitization and global dissemination of primary biodiversity data (e.g., data from natural history collections, libraries and databases). GBIF taxon searches can be limited to the country or countries of interest, or data can be downloaded and the necessary records extracted. To access data via GBIF (http://aegro.jki.bund.de/aegro/index.php?id=195):
-
Use the search facility to find data on your taxon of interest.
-
When you click on the taxon link provided, you will be asked to accept the terms of the GBIF user license agreement. Read the terms and then click on “Accept terms”.
-
You will then be provided with a number of links to data related to your taxon. Follow these links to find the information needed. For example, click on “occurrences” to find a list of recorded occurrences of the taxon (note that the map function will not show distribution data unless there are coordinates available).
-
To save a list of the occurrences, you can download the results in different table formats (i.e., as an MS Excel spreadsheet or as tab- or comma-delimited text).
-
Before you download the data, you can limit the fields included by unchecking the fields that are not needed. However, it is advisable to download all data, then delete or hide those fields that are not needed, in case the data might be of use at a later date.
GBIF has rapidly become the largest web-enabled supplier of nomenclatural, distribution, conservation and environmental data, drawing information from a growing global network of natural history collections and associated agencies.
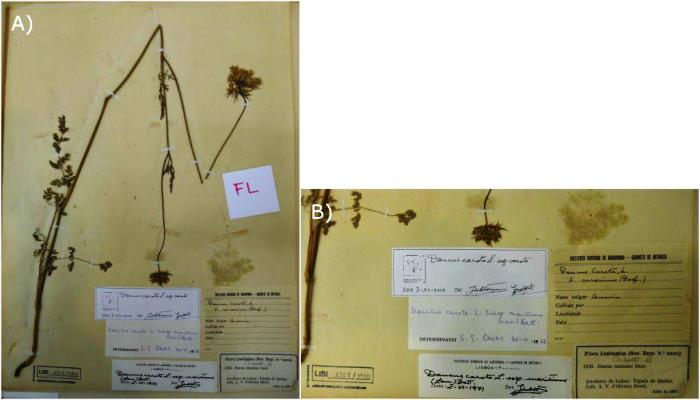 |
|
|
Example of specimen and label for digitization from Herbário João de Carvalho e Vasconcellos, Instituto Superior de Agronomia, Lisbon, Portugal (Photos: N. P. Castañeda Álvarez) |
The plant information accessible via GBIF is primarily derived from digitized herbarium or field records. There are other initiatives being developed to provide access to herbarium specimens, as well as national programs that are digitizing their collections and making the data available via the internet (table 14.1). Therefore, once the priority list of herbaria and gene banks that are likely to contain the necessary CWR collections have been identified, the herbarium and gene bank websites should be visited to see if the required data are online, which would further reduce the need and expense of visits to herbaria and gene banks.
Table 14.1: Data on Herbarium and National Collections Being Digitized for Internet Access
|
|
|
|
||
|
JSTOR Plant Science |
images of specimens from 155 institutions |
|||
|
|
||||
|
GENESYS |
a global portal to germplasm accession holdings of plant genetic resources for food and agriculture |
|||
|
European Plant Genetic Resources Search Catalogue (EURISCO) |
||||
|
System-wide Information Network for Genetic Resources (SINGER) |
||||
|
Genetic Resources Information Network of the United States Department of Agriculture (GRIN) |
||||
|
|
||||
|
|
||||
|
|
||||
|
|
||||
|
Russia |
AgroAtlas |
|||
|
Brazil |
CRIA |
|||
|
Japan |
NIAS |
|||
|
Mexico |
||||
|
|
||||
|
Harold and Adele Lieberman Germplasm Bank (cereals) |
||||
|
Manchester Museum |
||||
|
Millennium Seed Bank, Kew |
www.kew.org/science-conservation/save-seed-prosper/millennium-seed-bank/index.htm |
|||
|
National History Museum, UK |
||||
|
Royal Botanic Gardens Kew |
||||
|
Royal Botanical Garden of Edinburgh |
||||
|
SolanaceaeSource |
www.nhm.ac.uk/research-curation/research/projects/solanaceaesource |
|||
|
United States Virtual Herbarium |
||||
|
Virtual Australian Herbarium |
http://plantnet.rbgsyd.nsw.gov.au/HISCOM/Virtualherb/virtualherbarium.html#Virtual |
|||
One consequence of the recent efforts to digitize specimen and accession records and to make them available through multiple web-enabled databases and portals is that the same information may be duplicated in several sites. Care should be taken to eliminate duplicates if they are likely to bias subsequent analyses and give a false impression of the actual current conservation status of target taxa.
As shown in figure 14.1, not every specimen’s passport information from a particular herbarium is available through the internet; therefore, it is necessary to arrange visits to herbaria to query the local databases and also to get information for specimens that are not available through any database.
|
Figure 14.1: Availability of specimen information from the world’s main herbaria through GBIF |
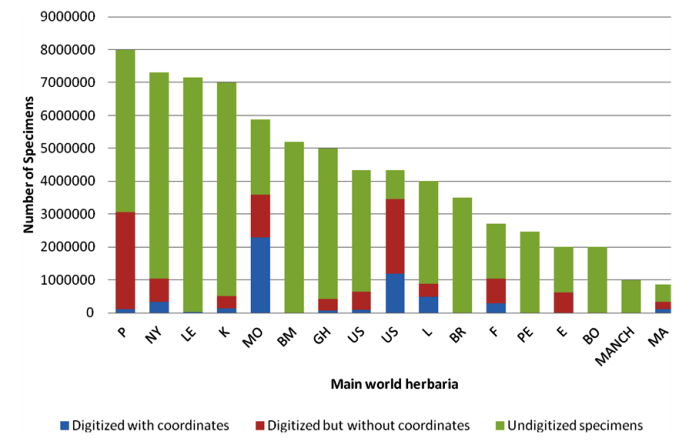 |
|
Note: P = Muséum National d'Histoire Naturelle, Paris; NY = New York Botanical Garden, New York; LE = Karmarov Institute, St Petersburg; K = Royal Botanic Gardens, Kew; MO = Missouri Botanical Garden, St Louis; GH = Harvard University, Cambridge, MA; US = Smithsonian Institution, Washington DC; L = Nationaal Herbarium Nederland, Leiden; BR = National Botanic Garden of Belgium, Meise; F = Field Museum of Natural History, Chicago; PE = Institute of Botany, Chinese Academy of Sciences, Beijing; E = Royal Botanic Garden, Edinburgh; BO = Herbarium Bogoriense, Cibinong; MANCH = University of Manchester, Manchester; MA = Real Jardín Botánico, Madrid. |
Methods for collecting ecogeographic data
|
Figure 14.2: Example of the photographic approach for a specimen of Solanum anguivi |
|
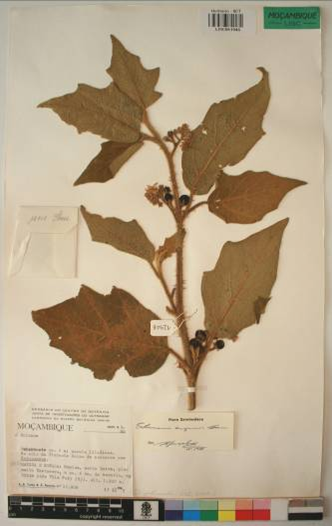 |
|
|
Source: Courtesy of Instituto de Investigação Científica Tropical–Jardim Botânico Tropical, Lisbon, Portugal. |
In the 1995 text, it was largely assumed that the way to collate ecogeographic data was for the conservationist to select priority herbaria or gene banks, visit the priority institutions, select specimens or accessions (largely on the basis of quality of ecogeographic data) and then type the selected specimen or accession passport data into a computer. This is still likely to be the most commonly used approach. However, currently this is not the only method that can be employed; the project on Adapting Agriculture to Climate Change, led by the Global Crop Diversity Trust (Guarino and Lobell 2011), is using an approach that is based more on photography (see figure 14.2). This involves visiting the priority herbaria, photographing the selected specimens, and then, back at base, working out the latitude and longitude necessary for GIS analysis (see Annex A for more detailed instructions). This approach has the obvious advantage of being relatively quick, therefore reducing the time the conservationist needs to spend at the host herbarium, and it provides a permanent image of the specimen, which can be checked if the identification is thought to be incorrect. It also means that specimen identification in the herbarium is not as critical because the image may later be seen and validated by an expert.
The Adapting Agriculture to Climate Change project has also defined the minimum threshold at 20 specimens, to produce a reliable distribution model representing the potential geographic areas in which the species might be found (Hernandez et al. 2006; Pearson et al. 2007; Wisz et al. 2008). Further, the project has extended the list of ecogeographic data that can be obtained from herbarium specimens (see Annex B).
On-line gazetteers
Ecogeographic data gathered through visits to herbaria, exchanges with other researchers, or querying online databases generates lists of locations where a certain specimen has been reported and/or collected. Recent collections might also include precise coordinates taken with GPS. When only a description of the locality is available, it is necessary to use some form of gazetteer to establish the location more precisely, a process that is sometimes called georeferencing.
Choosing which of the available strategies to use depends on the time and resources available. Manual methods (which use book gazetteers that list locations with latitude and longitude, and detailed maps) are still useful, particularly for those who are familiar with the localities where the specimen was originally collected. It is recommended that this strategy be applied to small datasets (i.e., fewer than 100 records) because it is very time consuming. Increasingly, for larger datasets, reliable online services, such as that of the National Geospatial-Intelligence Agency (NGA) (http://earth-info.nga.mil/gns/html), are used. The NGA provides the NGA GEOnet Names Server (GNS), which allows the user to retrieve information based on administrative and locality details. An advantage of this service is that it provides information about the features that are present in the area (e.g., rivers, populated areas, administrative divisions).
More-automated services are also available through the internet. However, care needs to be taken when using these; some are not always available because of lack of maintenance of servers, services that are no longer free, etc. They require data to be submitted in specific formats, and the percentage of locations found is usually low (only 10% to 15%). Biogeomancer (http://bg.berkeley.edu) is a widely known service aiming to improve the quality and quantity of biodiversity data represented in maps. It has an option to georeference records by batch, but first you are required to register on their site. The main advantage of Biogeomancer is that it calculates the uncertainty of each estimated coordinate, allowing the user to decide whether it is useful for his/her analysis. Although not implemented yet, the Google Geocoding API (https://developers.google.com/maps/documentation/geocoding) might also be a tool of interest for georeferencing biological data because of the search algorithms supported by Google and also the ease of creating personalized routines through the API.
Threat assessment
In recent years there have been several initiatives to conserve CWR diversity, most notably the project on Adapting Agriculture to Climate Change (Guarino and Lobell 2011). While this will result in more systematic complementary conservation of CWR diversity in time, the sheer numbers of CWR taxa make comprehensive CWR conservation unlikely. Conservationists will continue to need to prioritize and select which taxa to conserve. One commonly used means of doing this is relative threat.
It is recognized worldwide that biodiversity is currently under severe threat from a range of deleterious factors, such as habitat destruction, degradation and fragmentation, overexploitation, introduction of exotic species, and changes in agricultural practices and land use. However, the predicted impact of climate change is likely to be more catastrophic in terms of the loss of both species and infraspecific genetic diversity. Globally, Hilton-Taylor et al. (2008) estimate that since the year 1500, 115 plant species have become extinct or extinct in the wild, a further 8457 plant species are at risk of extinction, and approximately two-thirds of assessed plants are currently threatened. Further, climate change is predicted to increase average temperatures by 2°C to 4°C in Europe over the next 50 years, which will cause considerable changes in regional and seasonal patterns of precipitation (IPCC 2007). This will have a direct impact on the natural reproductive cycles and distribution of wild plant species, and is predicted to result in a 27% to 42% loss of plant species in Europe by 2080 (Thuiller et al. 2005) and a 60% loss of mountain plant species by 2100 (EEA 2009). Although it is difficult to quantify the loss of genetic diversity within species, it is likely to be very much greater than the loss of species themselves, given that most of the species that remain extant will suffer some loss of genetic diversity (Maxted 2003; Maxted et al. 1997a). It can be argued that CWR species are particularly threatened by climate change because many are associated with disturbed habitats (Hopkins and Maxted 2010) and these habitats are particularly threatened by climate change (Hopkins et al. 2007).
In the face of this level of threat, it is perhaps inevitable that the relative threat to a taxon will be used as a means of prioritizing plant genetic resources for conservation and that threat assessment will either be associated with or become an element of an ecogeographic survey, particularly given that the necessary data required for threat assessment are commonly generated during an ecogeographic survey. For general threat assessment and prioritization of biodiversity, the standardized system of applying the IUCN Red List categories (IUCN 2001) is commonly used. The IUCN threat assessment is data-driven on the basis of different criteria under which a taxon may be listed, each with distinct data requirements. However, the IUCN criteria assess the entire taxon, commonly at species level, and conservation of the range of genetic diversity within taxa or landraces is not easily considered. Various authors have used the IUCN Red List ethos to propose a set of categories and criteria for landrace threat assessment (Joshi et al. 2004; Porfiri et al. 2009).
Even with the limitations of assessing genetic diversity using the IUCN Red List categories, the technique is useful in distinguishing species-level priorities. The first extensive IUCN Red List assessment of CWR diversity has recently been published for European species (Bilz et al. 2011; Kell et al. 2012). In total, 571 native European CWR of high-priority human and animal food-crop species were assessed: 313 (55%) were assessed as Least Concern, 166 (29%) as Data Deficient, 26 (5%) as Near Threatened, 22 (4%) as Vulnerable, 25 (4%) as Endangered and 19 (3%) as Critically Endangered. All assessments have been published on the IUCN Red List website (www.iucnredlist.org). The most common threatening factors recorded were intensive “livestock farming and ranching”, increasing “tourism and recreation areas” and development of “housing and urban areas”. Nearly half of the CWR species had at least one accession conserved ex situ but virtually none were actively conserved in situ in protected areas. It would be useful if this initiative were repeated in other regions, as readily available Red List assessments would facilitate the ecogeographic process.
GIS analysis and prediction
Geographic information systems (GIS) have proved to be very flexible tools with applications in countless areas, including business, government, the sciences and nongovernmental organizations (ESRI 2012). The use of GIS for agriculture, ecology, biogeography and studies of natural resources has helped us to better understand patterns and relationships between different elements of nature. In particular, GIS has been used in studies of plant genetic resources to identify areas of high diversity (Maxted et al. 2004; Ocampo et al. 2007; Scheldeman et al. 2007; and chapter 15/16 in these updated Guidelines), species requiring further conservation (Dulloo et al. 1999; Jarvis et al. 2003), potential areas to collect germplasm (Ferguson et al. 1998; Jarvis et al. 2005; Parra-Quijano et al., 2011; Ramírez-Villegas et al. 2010), suitable areas for in situ conservation (Draper et al. 2003; Maxted 1995; Peters et al. 2005) and levels of threats affecting plant species (Jarvis et al. 2008), as well as creating informative compilations such as atlases (Azurdia et al. 2011; Hijmans et al. 2002).
Species distribution modelling (SDM) algorithms are tools frequently used in studies of plant genetic resources because they allow the prediction of areas that meet the environmental conditions required by a particular species. SDM inputs differ by algorithm (table 14.2).
Table 14.2: List of Algorithms for Species Distribution Modelling
|
Modelling algorithm |
Type of input required |
Software source |
|
Maxent (Phillips et al. 2006) |
Presence and absence |
|
|
Bioclim (Nix 1986) |
Presence data |
|
|
DOMAIN (Carpenter et al. 1993) |
Presence data |
|
|
Artificial Neural Networks (ANN) |
Presence data |
|
|
Ecological-Niche Factor Analysis – ENFA- |
Presence data |
|
|
Genetic Algorithm for Rule Set Production –GARP- (Stockwell and Noble 1992) |
Presence and absence data |
|
|
HABITAT (Walker and Cocks 1991) |
Presence data |
|
|
Generalized Linear Model-GLM- |
Presence and absence data |
R: package “dismo”, function “glm” |
|
Generalized Additive Model (GAM) |
Presence and absence |
R: package “mgcv” |
|
Mahalanobis Distance (MD) |
Presence data |
|
|
Classification Tree Analysis (CTA) |
R: package “BIOMOD” |
|
|
Surface Range Envelope (SRE) |
R: package “BIOMOD” |
|
|
Generalized Boosting Model (GBM) |
Presence and absence data |
R: package “BIOMOD” |
|
Breiman and Cutler’s random forest for classification and regression (RF) |
R: package “BIOMOD” |
|
|
Flexible Discriminant Analysis (FDA) |
R: package “BIOMOD” |
|
|
Multiple Adaptive Regression Splines (MARS) |
Presence and absence data |
R: package “BIOMOD” |
SDM algorithms require inputs as presence (and absence) data and environmental layers. Sources of environmental layers at the global scale are Worldclim (www.worldclim.org), which offers precipitation and temperature layers (Hijmans et al. 2005), SRTM-CIAT (http://srtm.csi.cgiar.org), containing digital elevation data, and Global Land Cover (http://glcf.umiacs.umd.edu).
Assessing the impact of climate change
Climate change is a global concern, as growing evidence demonstrates that it is already happening and future scenarios calculate that its effects are likely to have a drastic impact on life on earth (IPCC 2001, 2007). Agrobiodiversity is not an exception; it also is likely to suffer genetic erosion and extinction, but crop landrace and CWR diversity are expected to offer sources of traits to adapt crops to climate change (Farooq and El-Azam 2004; Hajjar and Hodgkin 2007; Maxted et al. 1997). However, other taxa might not respond adequately to such effects of climate change as floods, drought, heat and changes in precipitation patterns.
Analysis based on algorithms that model species distribution and on global circulation models (GCMs) permit us to produce estimates on how climate change will affect the environmental conditions where species are found. One such study is by Jarvis et al. (2008), which evaluated the predicted impact of climate change by 2055 on the CWR of groundnut (Arachis), potato (Solanum tuberosum) and cowpea (Vigna), finding that 16% to 22% of all species modelled (316) are at risk of extinction, while a significant number of species might lose more than 50% of their geographic coverage. Perhaps also of concern was the finding that the predicted impact of climate change varied significantly between crops: they found that 24 to 31 (of the 51) Arachis species were projected to become extinct and their distribution area reduced by 85% to 94% over the next 50 years, while Vigna species were predicted to lose only zero to two of the 48 species. This demonstrates the importance of assessing the impact of climate change for all landraces or CWR taxa in threatened areas.
Links to germplasm use
As noted above, in recent years there have been several initiatives to systematically conserve CWR diversity; however, the goal of genetic conservation is not just to maximize the genetic diversity conserved but also to promote its exploitation, and users are more likely to exploit diversity if it is easily accessible and meets their requirements. Two consequences follow from this statement: first, although the two conservation strategies are complementary and should be applied together for any genepool, they are not of equal value in terms of their application for the user. It is well established that users are more likely to exploit ex situ conserved resources because of the ease of access; the greater likelihood that characterization, evaluation and pre-breeding has been undertaken; the fact that in situ conserved resources are likely to be more remote to the user; and seed will only be available for part of the growing cycle. As such, there is a utilization argument for always ensuring that in situ conserved material is also duplicated ex situ. Ex situ conservation is more than a mere safety back-up of in situ conservation.
Second, with limited resources for any form of active conservation, there will always be a need to prioritize target taxa, and if one of the reasons for conservation is utilization, then it can be argued that the conservationist should have a clear idea what the user community requires. Therefore, it can be argued that if it has not already been considered as part of the conservation commissioning process, an additional element of the ecogeographic survey would be a review of the user community’s requirements. And by “user community”, we would mean breeders attempting to address climate change mitigation or changing consumer demands, landscape restorers trying match taxa for planting in a particular locality, or disaster relief agencies or individual farmers trying to replace locally adapted crop landraces. FAO (2009) emphasizes that “Considerable opportunities exist for strengthening cooperation among those involved in the conservation and sustainable use of PGRFA, at all stages of the seed and food chain. Stronger links are needed, especially between plant breeders and those involved in the seed system, as well as between the public and private sectors.” An analysis of user requirements would ensure greater use of conserved material, ensure that conserved germplasm is more than a museum exhibit, secure the long-term future of the conservation action itself and, finally, create opportunities to develop new partnerships that bridge the gap between the conservation and use of CWR and landraces.
Future challenges/needs/gaps
It may be that, in time, ecogeographic surveys will be subsumed as a component of the more encompassing and structured gap analysis approach to conservation planning, but whether this is the case or not, the collation, analysis and use of ecogeographic data will remain a key facet of conservation planning.
It seems likely that, with time, the limited availability of passport data for ecogeographic analysis will diminish as more and more natural history collections are digitized and web-enabled, although this is likely to remain limited in smaller herbaria and gene banks where resources are scarce. The problem may be that the analysis of the vast ecogeographic datasets that are available, with such large and complex datasets, will require a new generation of analysis programs, in terms of both multivariate statistic and GIS capabilities. A key question also remains of how much data do we need to analyse in order to obtain a significant answer? How many herbarium records is enough? In the 1995 text, the authors concluded that “There is no specific answer to this question.” But, upon reflection, it now seems that more concrete advice would be helpful. As noted above, for the project on Adapting Agriculture to Climate Change, it is recommended that the passport data from a minimum of 20 specimens per species be included. However, a recent study by Feeley and Silman (2011a) concluded that significantly larger sample sizes (of 75 to 100) are required to accurately map species ranges, although they also note that only around 5% of tropical plant species are represented by more than 20 specimens (Feeley and Silman 2011b). The project on Adapting Agriculture to Climate Change could provide a practical answer to this question.
The ground-breaking paper published by Jarvis et al. (2008) evaluated the predicted impact of climate change on three crop genepools: groundnut (Arachis), potato (Solanum tuberosum) and cowpea (Vigna). They showed that all species modelled are at risk of extinction and some may lose more than 50% of their geographic coverage. An interesting facet of this analysis was that the genepools were predicted to respond significantly differently to climate change. What about a broader survey of crop genepools? We now have a global priority list of 1397 CWR species. How is each of them likely to respond and how will their vulnerability affect conservation priorities? Given the growing concern over the impact of climate change and food security, surely a broader survey is an urgent priority.
Einstein once commented that “God does not play dice” in relation to the formation of the universe. It can be equally argued that neither should conservationists. No conservationists would get into a land cruiser, drive and hope to bump into the plant they hope to conserve. Ecogeography is at the heart of all conservation planning; however, ecogeographic surveys are still too often commissioned on an ad hoc basis. It can be argued that adopting a more strategic approach to global, regional and national conservation planning would not only be effective but would also save scarce conservation resources.
Conclusions
There have been significant advances in the techniques associated with ecogeographic surveys in recent years, particularly in data capture and data analysis, but there are likely to be additional advances in the next few years. There will be a need for a new generation of multivariate statistical and GIS techniques to enable the potentially vast and complex datasets that are likely to become available for routine use in planning conservation activities.
Back to list of chapters on collecting
References and further reading
Azurdia C, Williams K, Williams D, Van Damme A, Jarvis A, Castaño S. 2011. Atlas of Guatemalan Crop Wild Relatives. Available online (accessed 10 June 2012): www.ars.usda.gov/ba/atlascwrguatemala.
Balmford A. 2003. Conservation planning in the real world: South Africa shows the way. Trends in Ecology and Evolution 18:435–438.
Bilz M, Kell SP, Maxted N, Lansdown RV. 2011. European Red List of Vascular Plants. Publications Office of the European Union, Luxembourg. Available online (accessed 18 June 2012): http://ec.europa.eu/environment/nature/conservation/species/redlist/downloads/European_vascular_plants.pdf
Brooks TM, Bakarr MI, Boucher T, da Fonseca GAB, Hilton-Taylor C, Hoekstra JM. 2004. Coverage provided by the global PA system: Is it enough? Bioscience 54(12):1081–1091.
Carpenter G, Gillison N, Winter J. 1993. DOMAIN: A flexible modeling procedure for mapping potential distributions of plants and animals. Biodiversity and conservation 2(6): 667–680.
Dietz RW, Czech B. 2005. Conservation deficits for the continental United States: An ecosystem gap analysis. Conservation Biology 19:1478–1487.
Draper D, Rosselló-Graell A, García C, Tauleigne Gomes C, Sérgio C. 2003. Application of GIS in plant conservation programmes in Portugal. Biological Conservation 113(3):337–349.
Dulloo ME, Guarino L, Engelmann F, Maxted N, Newbury HJ, Attere F, Ford-Lloyd BV. 1999. Complementary conservation strategies for the genus Coffea with special reference to the Mascarene Islands. Genetic Resources and Crop Evolution 45:565–579.
EEA. 2007. European Nature Information System (EUNIS). European Environment Agency, Copenhagen. Available online (accessed 10 June 2012): http://eunis.eea.europa.eu/index.jsp.
EEA. 2009. Distribution of Plant Species (CLIM 022). European Environment Agency, Copenhagen.
ESRI. 2012. What is GIS? Available online (accessed 10 June 2012): www.esri.com/what-is-gis/who-uses-gis.html.
FAO. 2009. Second Report on the State of the World’s Plant Genetic Resources for Food and Agriculture. Food and Agriculture Organization of the United Nations, Rome.
Farooq S, El-Azam F. 2004. Co-Existence of salt and drought tolerance in Triticeae. Hereditas 135(2–3): 205–210.
Feeley KJ, Silman MR. 2011a. The data void in modelling current and future distribution of tropical species. Environmental Conservation 24:733–740.
Feely KJ, Silman MR. 2011. Keep collecting: accurate species distribution modelling requires more collections than previously thought. Diversity and Distributions (2011):1–9. Available online (accessed 6 October 2011): www.wfu.edu/~silmanmr/labpage/publications/divdist.keep.collecting.2011.pdf.
Ferguson ME, Ford-Lloyd BV, Robertson LD, Maxted N, Newbury HJ. 1998. Mapping the geographical distribution of genetic variation in the genus Lens for the enhanced conservation of plant genetic diversity. Molecular Ecology 7:1743–1755.
GBIF. n.d. Global Biodiversity Information Facility – data portal. Available online (accessed 10 June 2012): http://data.gbif.org.
Guarino L, Lobell DB. 2011. A walk on the wild side. Nature Climate Change 1:374–375.
Guarino L, Maxted N, Chiwona EA. 2006. A methodological model for ecogeographic surveys of crops. IPGRI Technical Bulletin No. 9. International Plant Genetic Resources Institute, Rome.
Hajjar R, Hodgkin T. 2007. The use of wild relatives in crop improvement: A survey of developments over the last 20 years. Euphytica 156:1–13.
Harlan JR, de Wet JMJ. 1971. Towards a rational classification of cultivated plants. Taxon 20:509–517.
Hernandez PA, Graham CH, Master LL, Albert DL. 2006. The effect of sample size and species characteristics on performance of different species distribution modeling methods. Ecography 29(5):773–785. Available online (accessed 6 October 2011): http://onlinelibrary.wiley.com/doi/10.1111/j.0906-7590.2006.04700.x/abstract.
Hijmans R, Spooner D, Salas A, Guarino L, de La Cruz J. 2002. Atlas of Wild Potatoes. Systematic and Ecogeographic Studies on Crop Genepools 10. International Plant Genetic Resources Institute, Rome.
Hijmans RJ, Cameron SE, Parra JL, Jones PG, Jarvis A. 2005a. Very high resolution interpolated climate surfaces for global land areas. International Journal of Climatology 25:1965–1978. Available online (accessed 6 October 2011): www.worldclim.org/worldclim_IJC.pdf.
Hilton-Taylor C, Pollock CM, Chanson JS, Butchart SHM, Oldfield TEE, Katariya V. 2008. State of the world’s species. . In: Vié J-C, Hilton-Taylor C, Stuart SN, editors. Wildlife in a Changing World: An Analysis of the 2008 IUCN Red List of Threatened Species. International Union for Conservation of Nature, Gland, Switzerland. pp. 15–42.
Hirzel AH, Hausser J, Chessel D, Perrin N. 2002. Ecological-niche factor analysis: How to compute habitat-suitability maps without absence data? Ecology 83:2007–2036.
Hopkins J, Maxted N. 2010. Crop Wild Relatives: Plant Genetic Conservation for Food Security. Natural England, Peterborough, UK.
Hopkins JJ, Allison HM, Walmsley CA, Gaywood M, Thurgate G. 2007. Conserving Biodiversity in a Changing Climate: Guidance on Building Capacity to Adapt. Department for Environment, Food and Rural Affairs, London
Hunter D, Heywood V. 2011. Crop Wild Relatives: A Manual of In Situ Conservation. Earthscan, London.
IPCC. 2001. IPCC Third Assessment Report: Climate Change 2001 (TAR). Intergovernmental Panel on Climate Change, Geneva.
IPCC. 2007. Fourth Assessment Report: Climate Change 2007. Synthesis Report. Intergovernmental Panel on Climate Change, Geneva.
IUCN. 2001. IUCN Red List Categories and Criteria: Version 3.1. IUCN Species Survival Commission. International Union for Conservation of Nature and Natural Resources, Gland, Switzerland and Cambridge, UK. Available online (accessed 10 June 2012): www.iucnredlist.org/documents/redlist_cats_crit_en.pdf.
Jarvis A, Lane A, Hijmans RJ. 2008. The effect of climate change on crop wild relatives. Agriculture, Ecosystems and Environment 126:13–23. Available online (accessed 6 October 2011): www.abcic.org/index.php?option=com_docman&task=doc_download&gid=9&Itemid=77.
Jarvis A, Ferguson ME, Williams DE, Guarino L, Jones PG, Stalker HT, Valls JFM, Pittman RN, Simpson CE, Bramel P. 2003. Biogeography of wild Arachis: assessing conservation status and setting future priorities. Crop Science 43(3):1100–1108. Available online (accessed 6 October 2011): http://ciat-library.ciat.cgiar.org/Articulos_Ciat/ajarvis.pdf.
Jarvis A, Williams K, Williams D, Guarino L, Caballero P, Mottram G. 2005. Use of GIS for optimizing a collecting mission of rare wild pepper (Capsicum flexuosum Sendtn.) in Paraguay. Genetic Resources and Crop Evolution 52(6):671–682. Available online (accessed 18 February 2012): http://ddr.nal.usda.gov/handle/10113/18374.
Joshi BK, Upadhyay MP, Gauchan D, Sthapit BR, Joshi KD. 2004. Red listing of agricultural crop species, varieties and landraces. Nepal Agricultural Research Journal 5:73–80.
Kell SP, Maxted N, Bilz M. 2012. European crop wild relative threat assessment: Knowledge gained and lessons learnt. In: Maxted N, Dulloo ME, Ford-Lloyd BV, Frese L, Iriondo JM, Pinheiro de Carvalho MAA, editors. Agrobiodiversity Conservation: Securing the Diversity of Crop Wild Relatives and Landraces. CAB International, Wallingford. pp. 218–242.
Margules CR. 1989. Introduction to some Australian developments in conservation evaluation. Biological Conservation 50:1–11.
Margules CR, Pressey RL. 2000. Systematic conservation planning. Nature 405(6873):243–253.
Margules CR, Nicholls AO, Pressey PL. 1988. Selecting networks of reserves to maximize biological diversity. Biological Conservation 43:63–76.
Maxted N. 1995. An Ecogeographic Study of Vicia Subgenus Vicia. Systematic and Ecogeographic Studies in Crop Genepools 8. International Board for Plant Genetic Resources, Rome.
Maxted, N. 2003. Conserving the genetic resources of crop wild relatives in European protected areas. Biological Conservation 113(3): 411–417.
Maxted N, Guarino L. 2003. Planning plant genetic conservation. In: Smith RD, Dickie JB, Linington SH, Pritchard HW, Probert RJ, editors. Seed Conservation: Turning Science into Practice. Royal Botanic Gardens, Kew. pp 37–78.
Maxted N, Hawkes JG, Guarino L, Sawkins M. 1997a. Towards the selection of taxa for plant genetic conservation. Genetic Resources and Crop Evolution 44:337–348.
Maxted N, Ford-Lloyd BV, Hawkes JG, editors. 1997b. Plant Genetic Conservation: The In Situ Approach. Chapman & Hall, London.
Maxted N, Mabuza-Dlamini P, Moss H, Padulosi S, Jarvis A, Guarino L. 2004. An Ecogeographic Survey: African Vigna. Systematic and Ecogeographic Studies of Crop Genepools 10. International Board for Plant Genetic Resources, Rome.
Maxted N, Ford-Lloyd BV, Jury SL, Kell SP, Scholten MA. 2006. Towards a definition of a crop wild relative. Biodiversity and Conservation 15(8):2673–2685.
Maxted N, Dulloo E, Ford-Lloyd BV, Iriondo J, Jarvis A. 2008. Genetic gap analysis: A tool for more effective genetic conservation assessment. Diversity and Distributions 14:1018–1030.
Moore JD, Kell SP, Iriondo JM, Ford-Lloyd BV, Maxted N. 2008. CWRML: Representing crop wild relative conservation and use data in XML. BMC Bioinformatics 9: 116. DOI:10.1186/1471-2105-9-116.
Nix HA. 1986. A Biogeographic Analysis of Australian Elapid Snakes. Atlas of Elapid Snakes of Australia. Australian Flora and Fauna Series Number 7. Australian Government Publishing Service, Canberra.
Ocampo J, d’Eeckenbrugge C, Restrepo M, Jarvis A, Salazar M, Caetano C. 2007. Diversity of Colombian Passifloraceae: Biogeography and an updated list for conservation. Biota Colombiana 8(1):1–45.
Parra-Quijano M, Iriondo JM, Torres E. 2011. Improving representativeness of genebank collections through species distribution models, gap analysis and ecogeographical maps. Biodiversiy and Conservation 21:79–96.
Pearson R, Raxworthy C, Nakamura M, Townsend Peterson A. 2007. Predicting species distributions from small numbers of occurrence records: A test case using cryptic geckos in Madagascar. Journal of Biogeography 34(1): 102–117.
Peters M, Hyman G, Jones P. 2005. Identifying areas for field conservation of forages in Latin American disturbed environments. Ecology and Society 10(1). Available online (accessed 10 June 2012): www.ecologyandsociety.org/vol10/iss1/art1.
Phillips SJ, Anderson RP, Schapire RE. 2006. Maximum entropy modeling of species geographic distributions. Ecological Modelling 190:231–259. Available online (accessed 6 October 2011): www.cs.princeton.edu/~schapire/papers/ecolmod.pdf.
Porfiri O, Costanza MT, Negri V. 2009. Landrace inventories in Italy and the Lazio region: Case study. In: Veteläinen M, Negri V, Maxted N, editors. European Landraces: On-Farm Conservation, Management and Use. Bioversity Technical Bulletin 15. Bioversity International, Rome. pp. 117–123.
Ramírez-Villegas J, Khoury C, Jarvis A, Debouck DG, Guarino L. 2010. A gap analysis methodology for collecting crop genepools: a case study with Phaseolus beans. PLoS ONE 5(10):e13497. Available online (accessed 28 October 2011): http://www.plosone.org/article/info%3Adoi%2F10.1371%2Fjournal.pone.0013497.
Riemann H, Ezcurra E. 2005. Plant endemism and natural PAs in the peninsula of Baja California, Mexico. Biological Conservation 122:141–150.
Scheldeman X, Willemen L, d’Eeckenbrugge C, Romeijn-Peeters E, Restrepo M, Romero J, Jiménez D, Lobo M, Medina C, Reyes C, Rodríguez D, Ocampo JA, Van Damme P, Goetgebeur P. 2007. Distribution, diversity and environmental adaptation to highland papayas (Vasconcellea spp.) in tropical and subtropical America. Biodiversity Conservation 16:1867–1884.
Stockwell DR, Noble I. 1992. Induction of sets of rules from animal distribution data: A robust and informative method of analysis. Mathematics and Computers in Simulation 33:385–390.
Thiers B. n.d. Index Herbariorum: A Global Directory of Public Herbaria and Associated Staff. New York Botanical Garden's Virtual Herbarium, New York. Available online (accessed 10 June 2012): http://sweetgum.nybg.org/ih
Thuiller W, Lavorel S, Araújo MB, Sykes MT, Prentice IC. 2005. Climate change threats to plant diversity in Europe. Proceedings of the National Academy of Sciences 102(23):8245–8250.
Vincent HA, Wiersema J, Dobbie SL, Kell SP, Fielder H, Castañeda Alvarez NP, Guarino L, Eastwood R, Leόn B, Maxted N. 2012. A prioritised crop wild relative inventory to help underpin global food security. Science (in preparation).
Walker PA, Cocks KD. 1991. HABITAT: A procedure for modelling a disjoint environmental envelope for a plant or animal species. Global Ecology and Biogeography Letters 1:108–118.
Wisz M, Hijmans R, Li J, Peterson AT, Graham CH, Guisan A, NCEAS Predicting Species Distributions Working Group. 2008. Effects of sample size on the performance of species distribution models. Diversity and Distributions 14:763–773.
Access to Biological Collection Data, standard: http://wiki.tdwg.org/twiki/bin/view/ABCD/AbcdIntroduction
AgroAtlas (Russia): www.agroatlas.ru
Artificial Neural Networks (ANN): http://openmodeller.sourceforge.net
Bioclim (Nix 1986): http://diva-gis.org
Biogeomancer: http://bg.berkeley.edu
Botanic Garden Conservation International (BGCI) database: www.bgci.org/plant_search.php
Botanical Records and Herbarium Management (BRAHMS): http://dps.plants.ox.ac.uk/bol/brahms/Home/Index
CRIA (Brazil): www.cria.org.br
Darwin Core, standard: http://rs.tdwg.org/dwc/index.htm
DOMAIN (Carpenter et al. 1993): http://diva-gis.org
Ecological-Niche Factor Analysis (ENFA) (Hirzel et al. 2002): www2.unil.ch/biomapper
ENSCONET: http://enscobase.maich.gr
European Plant Genetic Resources Search Catalogue (EURISCO): http://eurisco.ecpgr.org/nc/home_page.html
GENESYS: www.genesys-pgr.org
Genetic Algorithm for Rule Set Production (GARP) (Stockwell and Noble 1992): www.nhm.ku.edu/desktopgarp
Genetic Resources Information Network of the United States Department of Agriculture (GRIN): www.ars-grin.gov/npgs/searchgrin.html
Global Biodiversity Information Facility (GBIF): http://data.gbif.org
Global Land Cover: http://glcf.umiacs.umd.edu
Global priority checklist (The Harlan and de Wet Crop Wild Relative Checklist): www.cwrdiversity.org/home/checklist
Google Geocoding API: https://developers.google.com/maps/documentation/geocoding
Harold and Adele Lieberman Germplasm Bank (cereals): www.tau.ac.il/lifesci/units/ICCI/genebank1.html
Index Herbariorum: http://sciweb.nybg.org/science2/IndexHerbariorum.asp
IUCN Red List: www.iucnredlist.org
JSTOR Plant Science (images of specimens from 155 institutions): http://plants.jstor.org
Mahalanobis Distance (MD): www.jennessent.com/arcview/mahalanobis_grids.htm
Manchester Museum: http://emu.man.ac.uk/mmcustom/BotQuery.php
Maxent (Phillips et al. 2006): www.cs.princeton.edu/~schapire/maxent
Mexico: www.biodiversidad.gob.mx/genes/proyectoMaices.html
Millennium Seed Bank, Kew: www.kew.org/science-conservation/save-seed-prosper/millennium-seed-bank/index.htm
National Geospatial-Intelligence: Agency (NGA), NGA GEOnet Names Server (GNS): http://earth-info.nga.mil/gns/html
National History Museum, UK: www.nhm.ac.uk/research-curation/collections/departmental-collections/botany-collections/search/index.php
NIAS (Japan): www.gene.affrc.go.jp/databases_en.php
Plant List: www.theplantlist.org
Royal Botanic Gardens Kew: http://apps.kew.org/herbcat/navigator.do
Royal Botanical Garden of Edinburgh: www.rbge.org.uk/databases
SolanaceaeSource: www.nhm.ac.uk/research-curation/research/projects/solanaceaesource
SRTM-CIAT: http://srtm.csi.cgiar.org
System-wide Information Network for Genetic Resources (SINGER): http://singer.cgiar.org
Taxonomic Databases Working Group (TDWG): www.tdwg.org
United States Virtual Herbarium: http://usvirtualherbarium.org
Virtual Australian Herbarium: http://plantnet.rbgsyd.nsw.gov.au/HISCOM/Virtualherb/virtualherbarium.html#Virtual
Worldclim: www.worldclim.org
Annex A. Digital Recording of Passport Data
Before digitization commences:
-
Seek and obtain permission from the host herbarium director to photograph the specimens before any specimens are photographed.
-
Be careful when manipulating specimens. Curators appreciate keeping the order of the collection intact, and require notification and authorization for the removal of any part of the dried plant.
-
Offer to provide the host herbarium with a complete set of the digitized photographs of the specimens and then repatriate the electronic dataset.
Equipment required for digital recording:
-
A digital camera, ideally with a minimum resolution of 6 megapixels (mpx).
-
Two storage device (SD) cards of at least 1–2 gigabytes (GB). Note, however, that depending on the camera you are using, the size in bytes of the SD card might affect the speed of the camera (the more bytes, the slower the performance). Having two SD cards available during the visit will allow you to take pictures continuously.
-
An extra battery for the camera, so one battery can be used while the other one is charging, to avoid delays while waiting for the battery to charge.
-
At least one external hard disk to store and back up all images taken during the visit.
-
List of target taxa whose specimens are to be digitized. The list should identify priority taxa (for when digitizing time is limited) and, if available, their native range.
-
Electronic or paper notebook to record the process of data collation.
-
Prepare paper tags with the abbreviations: “Fl”, “Fr” and “Inflo”. Using these tags will allow you to better capture the phenological status of the sample when digitization is taking place. Use “Fl” when the specimen is flowered, “Fr” when it has fruits and “Inflo” for the family Poaceae and when it is not possible to distinguish between flowering and fruiting.
Selecting the specimens to photograph:
-
First identify the system the herbarium follows to organize the collection (i.e., alphabetically, monocots and dicots separated, APGIII, etc.) and plan the digitization of the target taxa within the time available. Avoid over-digitization of some taxa at the expense of neglecting other priority taxa.
-
When you are familiar with the organization of the collection, start with the highest priority taxa.
-
The herbaria are likely to have tens, hundreds or even thousands of specimens of the priority taxa, so select only those to photograph that have the highest quality and the most complete passport data that can be digitized for latitude and longitude accurately (for example, this can be achieved for “10km NW from Cali”, but not for “20 minutes from Cali”). If a taxon is particularly rare or a specimen has some unique characteristic, then it might be worth digitizing a specimen with inferior passport data.
Recommendations when taking pictures:
-
Use the maximum resolution your camera offers. It is desirable to have at least 6 mpx.
-
Photograph the label and/or annotations of the specimen folder in order. This will help when organizing images and may be an additional source of determination information.
-
Photograph the whole specimen sheet. Try to include all annotations the specimen has (i.e., stamps, codes, fruits, flowers). Flowers and fruits are necessary to correlate with the collection date to identify the taxon’s collection window.
-
Photograph the herbarium label, determination label and any additional annotation in close-up.
-
When duplicates of two or more specimens are encountered that share the same collecting number, place the specimens side by side and photograph them together. (This will allow the digitizer to recognize morphological details—flower or fruits—from the dried plant.)
-
Once the images for a particular specimen have been taken, review the image; erase any blurry photographs and repeat the photograph if necessary. Things to avoid that might hamper image quality:
-
Avoid taking blurry photos; make sure the photo is correctly focused.
-
Avoid taking horizontally skewed photos as this might affect the collation of the label information.
-
Avoid using the digital zoom; specimens should be directly comparable.
-
Avoid casting a shadow across the specimen with your body while taking the photograph.
-
If possible use the “macro” option for taking the photograph as this will help maximize the capture of specimen details.
-
Avoid the use of flash as it will accentuate the shadows on the specimen; instead, try to take the photos in a well-lit spot in the herbarium.
-
Make sure you keep one, preferably two, back-ups of all photographs taken.
Organizing the images:
-
To provide security, it is best to periodically upload the collated images to an FTP site—as additional back-up security but also to provide access for the staff digitizing and georeferencing the specimens.
-
Before uploading images to the FTP site, rotate them as necessary so they appear in portrait form, then organize the images into a logical structure, such as:
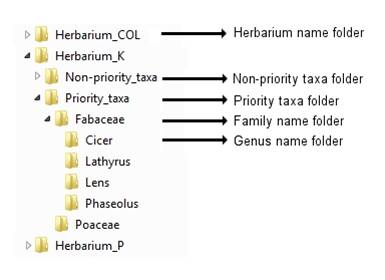
Figure 14.3: Recommended folder structure for storing herbarium images
Annex B. Extended List of Ecogeographic Data Descriptors
The ecogeographic data collection template is based on the template produced by the Millennium Seed Bank Enhancement Project Species Targeting Team (2004–2008), where it was used to capture all information from herbarium labels and subsequently georeference the locality data. The general template from the Botanical Records and Herbarium Management (BRAHMS) rapid data entry system was tailored to follow Royal Botanical Gardens, Kew’s core field standards, and the specific requirements of the project. The format allows the data to be directly used for analysis and mapping. The data collected formed the basis of seed collecting guides produced by Kew and distributed to collecting partners.
In the Adapting Agriculture to Climate Change project (see above), data will be utilized for gap analyses, as well as the production of collection guides. To reflect this extended use, additional fields have been added to the original template. These facilitate the collection of data from a wide range of sources (including public and private digital datasets, herbarium vouchers and genebank datasets) and the management of restrictions on data usage. The modifications were developed collaboratively by the Royal
Botanical Gardens, Kew; the International Centre for Tropical Agriculture (CIAT); and the University of Birmingham. As such, the data types are extensive but it is not necessary to have a complete set to undertake an ecogeographic analysis. However, the more complete the set, the more sophisticated the analysis and the more detailed the prediction and, ultimately, the conservation.
Click here to open a table of the Ecogeographic Data Descriptors.
After Vavilov: Collecting germplasm in the 21st century
E. Frison, Director General
Bioversity International, Maccarese, Rome, Italy
E-mail: e.frison(at)cgiar.org
|
2011 version |
1995 version |
||
|
Open the full chapter in PDF format by clicking on the icon above. |
|||
This chapter is a foreword to the synthesis of new knowledge, procedures, best practices and references for collecting plant diversity since the publication of the 1995 volume Collecting Plant Diversity: Technical Guidelines, edited by Luigi Guarino, V. Ramanatha Rao and Robert Reid, and published by CAB International on behalf of the International Plant Genetic Resources Institute (IPGRI) (now Bioversity International), the Food and Agriculture Organization of the United Nations (FAO), the World Conservation Union (IUCN) and the United Nations Environment Programme (UNEP). The original foreword, Loss of Plant Diversity: A Call for Action, authored by H. Zedan, has been made available online courtesy of CABI. The 2011 update of the Technical Guidelines, edited by L. Guarino, V. Ramanatha Rao and E. Goldberg, has been made available courtesy of Bioversity International.
Please send any comments on this chapter using the Comments feature at the bottom of this page. If you wish to contribute new content or references on the subject please do so here.
Back to list of chapters on collecting
Nikolay Ivanovich Vavilov, the great Russian plant explorer and collector, was born 125 years ago, in 1887. Having more or less single-handedly established the scientific fields encompassed by “collecting plant genetic diversity”, I imagine he would be intimately familiar with today’s activities in that realm, as set out in the original 1995 edition of these Technical Guidelines. Today, looking through the new and revised chapters of this new edition, Vavilov might well be thrilled by some of the new opportunities, and at the same time, puzzled by some of the changes that have overtaken the field.
 |
|
|
Nikolai Ivanovich Vavilov (1887—1943) was a prominent Russian botanist and geneticist best known for having identified the centres of origin of many cultivated plants. He devoted his life to collecting crop diversity and conserving it in genebanks as material for breeders. |
Seventeen years after the first edition, genetic diversity continues to be lost as a result of changes in agriculture and the transformation of the landscape. The apparently unstoppable growth of simplified agricultural systems based on genetically uniform crops displaces the very diversity on which plant breeders depend to improve the crops they work on. Growing cities and expanding agricultural lands swallow up wild and semi-wild areas of nature that harbour diverse crops and their wild relatives. Unless the diversity of crops and their wild relatives is collected and conserved, it cannot be used either by breeders or by farmers seeking to adapt their systems to impending challenges.
Climate change and population growth are the two primary challenges that agriculture will need to respond to. All the models predict greater extremes in the variability of weather in the near future, and these shifts in abiotic conditions will be accompanied by shifts in the biotic threats posed by pests and diseases. Genetic diversity will be needed to respond to those threats. Add to climate change the predicted nine billion people who will need to be fed and properly nourished in 2050, against a background of shortages of water and suitable land, and it becomes clear that the world needs to collect and conserve genetic diversity.
Estimates of how much is being lost, and how quickly, abound; and yet in striving to put accurate numbers on these phenomena, these estimates risk missing the point. One of the crucial lessons that more than a century of collecting and conservation (and an even longer history of breeding) has taught, is that it is impossible to predict what specifically ought to be conserved. Time and again, unforeseeable challenges have been solved thanks to unremarked genetic diversity. Conserved, in situ or in a genebank, diversity may prove to be useful; once lost, it cannot ever be useful.
Having said that, it is clear that in a time of limited resources, we cannot simply go out there and collect everything. New approaches to priority setting would, I think, have thrilled Vavilov. Instead of heading hopefully off into uncharted regions on the fringes of civilization, today’s plant collectors can bring an array of sophisticated tools to bear. Geographical information systems (GIS), coupled with genebank and herbarium data and integrated with climate data and predictions, make it possible to identify with great precision where collectors ought to go to stand the best chance of finding what they are looking for. This approach can be used to fill the gaps in existing genebank collections, to target geographical areas that are threatened by climate change or habitat degradation, and to concentrate the search for diversity that could help in the battle to adapt to climate change in so-called climate analogues, places whose climate now matches the predicted future climate for a different place. Of course, plant collectors may still need to explore uncharted regions on the fringes of civilization, but they will have good reasons for going there and a reasonable expectation of success.
Another aspect of modern collecting that might thrill Vavilov is the nature and extent of information about genetic diversity, and the uses to which it can be put. Being able easily to pinpoint geographic position with a reasonably smart phone enables all sorts of further analyses. Beyond that, however, there is also much greater scope for collecting information on the ways in which local people use plants, on the plant’s performance and traits in the field, on the conditions where it grows and so on. Indeed, collecting the plant’s DNA directly, rather than seeds or larger samples, is an increasingly useful activity. In future this kind of information will be integrated with larger-scale data—climate, for example, and finer-scale observations, such as characterization and evaluations from genebanks and even molecular markers—to give a much fuller picture of diversity that will narrow the search for suitable material.
What, then, of the difficulties? One of Vavilov’s frustrations was his inability to get a visa to explore Egypt. Today, visas and travel are probably easier, but the international legal framework surrounding ex situ conservation has become much more complex with the increased use of intellectual property rights for crop varieties on the one hand and the exertion of sovereign rights of countries over the genetic resources within their borders on the other. This has led to the adoption of the Convention on Biological Diversity in 1993, which has resulted in reduced flows of genetic diversity into and out of genebanks. The International Treaty on Plant Genetic Resources for Food and Agriculture (the Treaty) goes a long way towards recreating a commons for plant genetic resources for food and agriculture, with its multilateral system of access and benefit sharing and agreed protocols for exchanging and using genetic diversity. The Treaty ought to unlock the flow of genetic diversity, which will be absolutely essential for future food security. Nevertheless, challenges remain, as many countries that have ratified the Treaty still have to put in place the appropriate mechanisms, policies and, in some cases, legislation to fully implement it. Unless this is done, it is unlikely that countries will be able to access the diversity they will need to feed and properly nourish nine billion people in 2050.
Despite the potential difficulties, countries will continue to depend on “foreign” genetic resources for their future food security, an interdependence that long predates the rise of sovereign states and that arguably stretches back to the dissemination of tools and techniques that constituted the agricultural revolution of the Neolithic. Dedicated, professional collectors are often the entry point into the web of connections that underpins global interdependence. The new and revised chapters of these Technical Guidelines represent a contribution to the creation of future collectors and collections, needed now as much as or more than they were in Vavilov’s day.
One of Vavilov’s favourite sayings was, “Life is short, we must hurry.” Were he miraculously to walk among us again, I would not hesitate to save his time by commending to him the chapters in this updated edition of the classic handbook on collecting genetic resources.
Back to list of chapters on collecting
Chapter 41: Gap analysis: A tool for genetic conservation
N. Maxted
School of Biosciences University of Birmingham, Edgbaston Birmingham, UK
E-mail: n.maxted(at)bham.ac.uk
N. P. Castañeda Álvarez
International Center for Tropical Agriculture (CIAT)—Bioversity International Cali, Colombia and School of Biosciences University of Birmingham, Edgbaston Birmingham, UK
E-mail: n.p.castaneda(at)cgiar.org
H. A. Vincent
School of Biosciences University of Birmingham, Edgbaston Birmingham, UK
E-mail: holly.vincent(at)gmail.com
J. Magos Brehm
School of Biosciences University of Birmingham, Edgbaston Birmingham, UK
E-mail: joanabrehm(at)gmail.com
|
|
|||
|
Open the full chapter in PDF format by clicking on the icon above. |
|||
This chapter is a synthesis of new knowledge, procedures, best practices and references for collecting plant diversity since the publication of the 1995 volume Collecting Plant Diversity: Technical Guidelines, edited by Luigi Guarino, V. Ramanatha Rao and Robert Reid, and published by CAB International on behalf of the International Plant Genetic Resources Institute (IPGRI) (now Bioversity International), the Food and Agriculture Organization of the United Nations (FAO), the World Conservation Union (IUCN) and the United Nations Environment Programme (UNEP). The 2011 update of the Technical Guidelines, edited by L. Guarino, V. Ramanatha Rao and E. Goldberg, has been made available courtesy of Bioversity International.
Please send any comments on this chapter using the Comments feature at the bottom of this page. If you wish to contribute new content or references on the subject please do so here.
Back to list of chapters on collecting
Internet resources for this chapter
Abstract
Gap analysis is a well-established conservation technique used by ecological conservationists to identify areas in which selected elements of biodiversity are represented. Through comparison with existing in situ protected-area networks, it identifies habitats or ecosystems that need additional protection. However, the methodology has recently been adapted for application in the context of broader agro-biodiversity conservation, to encompass both in situ and ex situ strategies for conserving genetic diversity. The extended methodology involves the following steps: (a) circumscription of target taxon and target area, (b) assessment of natural diversity through a review of intrinsic taxonomic, genetic and ecogeographic diversity combined with threat assessment, (c) assessment of current complementary between in situ and ex situ conservation strategies, (d) reformulation of the conservation strategy through analysis of the differences between the pattern of natural, intrinsic diversity and the elements of that diversity already effectively represented by existing in situ and ex situ conservation actions. The methodology is reviewed and illustrated using various temperate and tropical examples of crop wild relatives and landraces.
Introduction
When the original text for chapter 14 of these Technical Guidelines, on ecogeographic surveys, was being prepared, knowledge of the early application of ecological gap analysis was limited and still in the early stages of development (Burley, 1988; Margules et al., 1988; Margules, 1989; Pressey and Nicholls, 1989; Pressey et al., 1993). However, an extensive literature on “gap analysis” (i.e., how to identify areas in which selected elements of biodiversity are underrepresented) has subsequently arisen, including Margules and Pressey (2000) Balmford (2003), Brooks et al. (2004), Lipow et al. (2004), Dietz and Czech (2005), and Riemann and Ezcurra (2005). Although within the wider conservation community, the literature on gap analysis was originally and is still primarily applied to indigenous forests (particularly on small islands rich in endemic species), the technique has recently been extended to agro-biodiversity conservation, encompassing conservation strategies for both in situ and ex situ genetic diversity. Maxted et al. (2008a) showed how the existing methodology might be adapted for more general conservation use and proposed a specific methodology. Subsequently, gap analysis has rapidly established itself as the methodology for conservation planning (FAO, 2009; Maxted and Kell, 2009; Parra-Quijano et al., 2012a; Ramírez-Villegas et al., 2010). As stressed in the update of chapter 14 on ecogeographic surveys, the current application of gap analysis techniques is not replacing ecogeography; it has, in effect, subsumed ecogeography as an element within the broader, more schematic gap analysis protocol. As such, ecogeographic surveys will continue to be routinely undertaken, but increasingly within the broader context of gap analysis. Therefore, chapter 14 can be seen as a sister chapter to this chapter, which specifically addresses gap analysis and should be read in conjunction with that chapter. Both ecogeographic surveys and gap analysis form essential components in planning for plant genetic-resource conservation.
The basic premise of gap analysis is that the target taxon’s ecogeographic and genetic distribution and diversity are compared with the elements that are currently actively conserved.1 The “gap” is therefore the component of the target taxon’s ecogeographic and genetic distribution and diversity that is not currently actively conserved and which becomes the conservation priority. As such, the protocol for genetic gap analysis involves four steps: (a) circumscription of taxa, (b) identifying the breadth of ecogeographic and genetic distribution and diversity for the target taxa, (c) matching current in situ and ex situ conservation actions with the breadth of ecogeographic and genetic distribution and diversity to identify the conservation “gaps” and (d) formulating a revised in situ and ex situ conservation strategy (Maxted et al., 2008a).
1 “Active conservation” is where the target taxon population is specifically managed to maintain its diversity, as opposed to “passive conservation” where the site is managed and it is hoped that the target taxon population benefits from the general site-based management.
Current status
Circumscription of target taxon and target area
The first step in the gap analysis protocol is to establish the taxonomic (e.g., genus, section or species) and geographic (e.g., global, regional, country or provincial) breadth of the analysis. The approach that has largely been applied thus far is for individual analyses to focus on distinct crop genepools, see Maxted et al. (2005), Maxted et al. (2008b) and the CIAT-IRRI-Bioversity International GapAnalysis project (http://gisweb.ciat.cgiar.org/gapanalysis). However, in terms of establishing in situ and ex situ conservation priorities, it might be of greater practical value and more cost efficient to establish multi-genepool conservation targets irrespective of individual genepool results, so collection or establishing genetic reserves is led by overall targets for plant genetic resources. This multi-genepool approach was taken by Maxted et al. (2012) for the temperate legume genera Cicer, Lathyrus, Lens, Medicago, Pisum and Vicia species (see figure 41.1) and by Whitehouse (2011) for the in situ conservation of temperate cereal genera Avena, Aegilops, Hordeum, Secale and Triticum (see figure 41.2). Interestingly, both the legume and cereal analysis showed the area at the northern end of the Bekaa Valley in Lebanon and Syria to be a target for in situ and ex situ conservation action for both wild legumes and cereals. Both analyses showed some coincidence between undertaking the analysis for each genepool separately and the combined legume or cereal analyses, but for the legumes, the chickpea and the oat genepools, the individual analyses were quite distinct from the combined analyses.
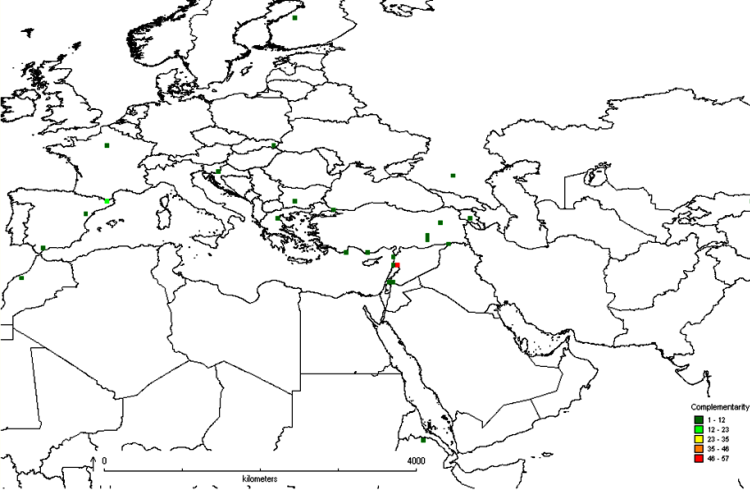 |
|
Figure 41.1: Complementarity analysis for Cicer, Lathyrus, Lens, Medicago, Pisum and Vicia species. |
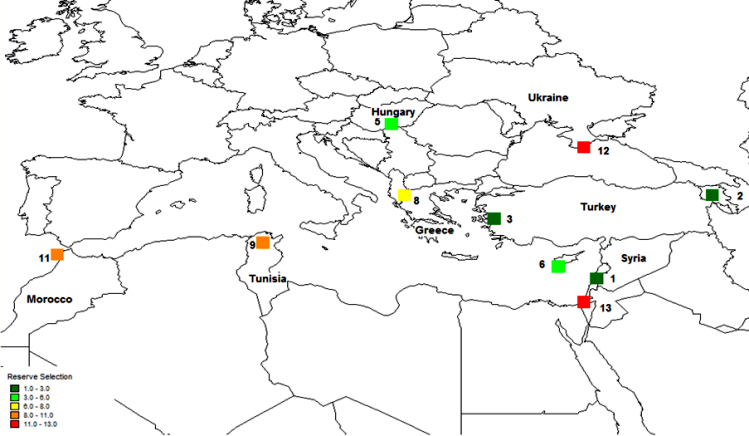 |
|
Figure 41.2: Complementary analysis Avena, Aegilops, Hordeum, Secale and Triticum species. |
Further, the International Center for Tropical Agriculture (CIAT) in collaboration with the International Rice Research Institute (IRRI) and Bioversity International undertook a gap analysis to identify the gaps in the ex situ collections of the crop wild relatives (CWR) of 13 crop genepools2 (figure 41.3) (see http://gisweb.ciat.cgiar.org/gapanalysis), using all the species in the genus as the basis of the analysis. The conclusion was that if overall conservation of plant genetic resources is the aim, combining genepools for analysis may be an effective technique for identifying the highest priority sites but individual genepool priorities might be missed where the included taxa deviate from the combined norm, so a combination of using the individual and combined genepool approach is recommended.
2 Pigeon pea (Cajanus), chickpea (Cicer), finger millet (Eleusine), barley (Hordeum), lentil (Lens), pearl millet (Pennisetum), bean (Phaseolus), sorghum (Sorghum), wheat (Triticum and Aegilops), faba bean (Vicia), cowpea (Vigna) and maize (Zea).
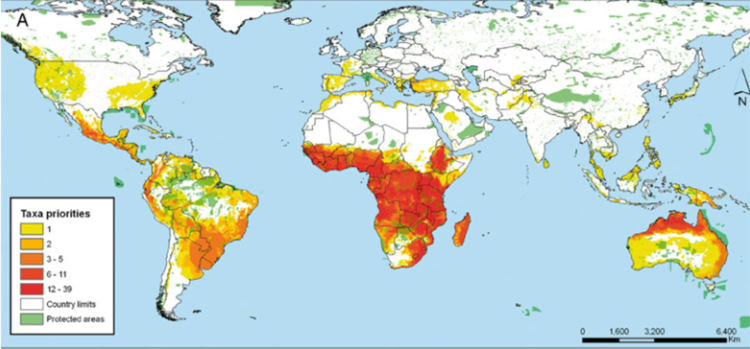 |
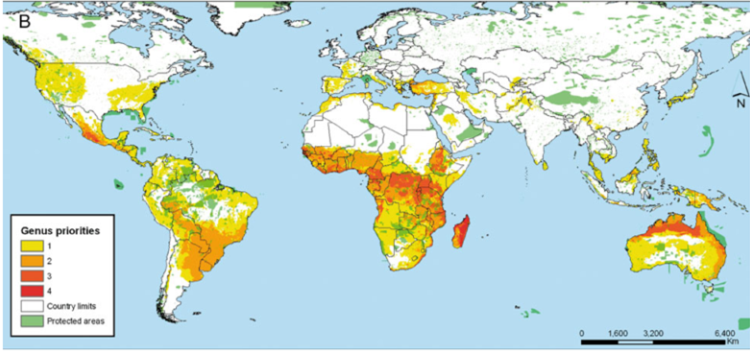 |
|
Figure 41.3: Priorities for in situ and ex situ conservation of the crop wild relatives of 13 genepools: |
In the case of the CIAT study, a large number of taxa and areas were identified as priorities for conservation. As seen in figure 41.3, the number of taxa requiring further conservation is concentrated in a wide proportion of the African continent and northern Australia. When these priorities are summarized at the genus level, places where four different genera are potentially found is Madagascar, followed by central Africa, northern Australia and western Mexico. What all these priority regions have in common is the absence of large protected areas that could serve for the in situ conservation of the plant genetic resources of the crops aforementioned.
Subsequently, it has been proposed that gap analysis should not be based on the whole genus alone, but should also consider the analysis of the priority species as well, the reason being that in larger genera, the bulk of the species that are unlikely to be of immediate potential use might mask the ecogeographic distribution of those species of highest potential value. This can be illustrated by the case of cowpea relatives in sub-Saharan Africa. Moray and Maxted (2012) compared the results of analysing the whole genus of 124 Vigna taxa with the 14 Vigna taxa present in the primary (gp1) and secondary genepools (gp2), those most closely related to cowpea, and, perhaps not surprisingly, found the results were distinct (see figures 41.4 and 41.5). The conclusion was that if you are trying to establish the priority areas for ex situ or in situ conservation, then, as funds are likely to be limiting, the gap analysis should consider the priority taxa alone as well as the whole genus, allowing an informed decision to be made as to where to focus conservation. As noted in chapter 14, a Harlan and de Wet Global Priority Checklist of CWR Taxa (Vincent et al., 2012) is now available for 173 crop genepools, based on a published genepool and taxon group concept (see www.cwrdiversity.org). This will guide those wishing to establish which CWR should be included in gap analysis based on their priority as trait donors for breeding.
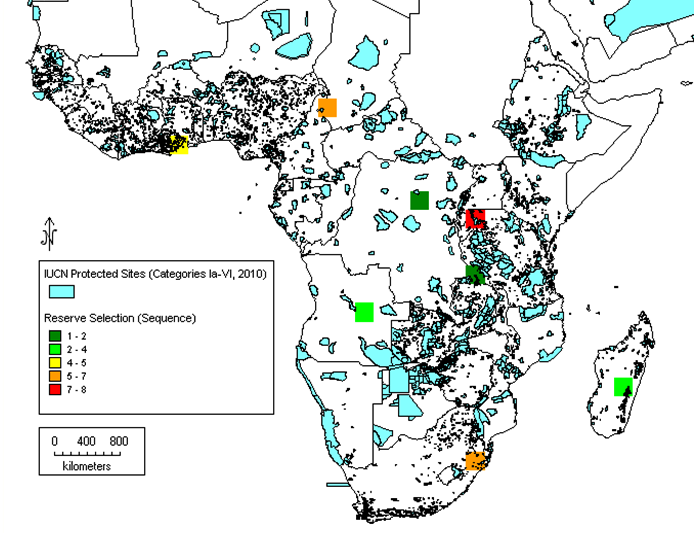 |
|
Figure 41.4: Complementary analysis for all 124 African Vigna taxa. Note: The darker green squares represent the highest priority regions for conservation, while the orange and red squares identify areas of lower priority. |
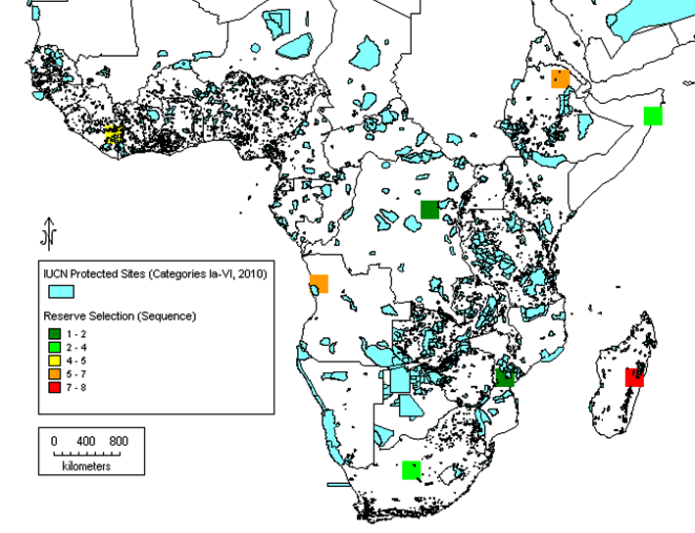 |
|
Figure 41.5: Complementary analysis for 14 priority African Vigna taxa (primary and secondary CWR taxa). |
A third option would be to give different weights to different species in the analysis, based on their relative rarity. See Arponen et al. (2005) and Venevsky and Venevskaya (2005) for further discussion of weighted endemism. This approach has yet to be widely applied in the context of genetic resources but is available in the WorldMap software (see internet resources, below). It is also advisable not to ignore the wider potential genepool, which might contain further non-genepool and taxon group-concept priority taxa with useful traits, especially if tertiary genepool taxa have previously been used in breeding.
Assessment of natural diversity
The level of diversity occurring within the target taxon must be defined at the taxonomic, genetic or ecogeographic levels (i.e., how many taxa occur in the circumscribed taxon and what is their ecogeographic pattern of distribution).
Assessment of taxonomic diversity
Assessing taxonomic diversity involves listing the taxa encompassed by the taxonomic circumspection, whether for the entire genus or for genera (as in the case of Triticum aestivum, which has priority species in three genera: Aegilops, Amblyopyrum and Triticum). This is likely to involve identifying the accepted classification for the target taxon by consulting specialist publications and taxon experts, or searching online sources of information. As noted above, the analysis will usually be based on the highest priority taxa in genepool GP1B or GP2 or, if the genepool concept is unavailable, the equivalent taxon group TG1-3. Genepool and taxon group concepts with the included accepted taxa and synonyms are listed in the Harlan and de Wet Global Priority Checklist of CWR Taxa (Vincent et al., 2012) (see www.cwrdiversity.org).
Assessment of genetic diversity
Having established the list of taxa to be included in the gap analysis, the next step would be to collate existing data or generate new data on the inherent genetic diversity within those taxa. However, this might not be realistic because the knowledge about inherent patterns of genetic diversity is often limited and it could be too resource intensive to collate de novo. Consequently, genetically based approaches to conservation assessment, either in terms of “richness” (the total number of genotypes or alleles present regardless of frequency) or “evenness” (the evenness of the frequencies of different alleles or genotypes), can therefore only be applied to the most highly prioritized taxa. However, proxy or surrogate measures of genetic diversity may be applied, and it can be argued that ecogeography can act as an adequate proxy when there is a lack of specific data on genetic diversity. It should be remembered, however, that using any proxy will not be as accurate as using primary data.
As an example of the use of data on genetic diversity in conservation planning, van Zonneveld et al. (2012) used microsatellite markers to understand the spatial genetic diversity of Annona cherimola throughout the Andean region in Peru, Ecuador and Bolivia, finding places with the highest genetic diversity (southern Ecuador and northern Peru), places that are a priority for in situ conservation (southern Ecuador and northern Peru) and existing gaps in ex situ collections (southern Ecuador). In a classic study, Ferguson et al. (1998) investigated the relationship between ecogeography and genetic diversity in the wild lentil genepool. The distribution and genetic diversity of Lens culinaris subsp. orientalis show that the subspecies is geographically distributed from western Turkey to Tajikistan, but if the genetic diversity is partitioned into 10 clusters, then the bulk of the genetic diversity is focused almost entirely in the western part of the fertile crescent; thus, in this case, ecogeographic data would not be an adequate proxy for genetic diversity as it would indicate ex situ sampling or the establishment of an in situ genetic reserve across the geographic distribution rather than concentrating both in the western Fertile Crescent, as indicated in figure 41.6. Whether genetic diversity is studied or, as commonly occurs, ecogeography is used as a proxy for genetic diversity, an additional assessment will need to be made of the genetic diversity that exists in natural taxa or populations in order to determine if it is well represented by the samples held in genebanks or by populations represented in protected areas or genetic reserves.
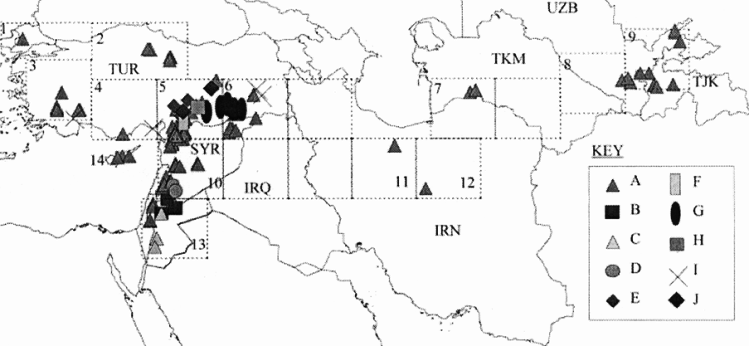 |
|
Figure 41.6: Distribution of Lens culinaris subsp. orientalis divided into 10 clusters of genetic diversity. |
Assessment of ecogeographic diversity
As there is a lack of knowledge of natural patterns of genetic diversity for the vast majority of crop wild relatives, it is often necessary to employ some form of proxy measure such as ecogeographic diversity (merely because of the prohibitive cost of undertaking genetic diversity studies de novo), even if we know that it might not be an adequate proxy of genetic diversity. Assessing ecogeographic diversity involves the collation of secondary information on the ecology and geography of the species under study (see chapter 14; Guarino et al., 2006; Maxted and Guarino, 2003). The collation and analysis of ecogeographic data is discussed in detail in the original version of chapter 14, along with its update, and so will not be reiterated here.
Recently, Parra-Quijano et al. (2012b) extended the concept of ecogeographic analysis by creating and testing an ecogeographic land characterization map for Spain. The map characterized the habitat preferences of plant species and their adaptations to the environment. Subsequently, this map was used for identifying ecogeographic gaps by comparing those categories represented in ex situ facilities with the categories occurring within the potential niche of the species (Parra-Quijano et al., 2011a). During the collection stage, Parra-Quijano et al. (2011a) identified two populations of Lupinus angustifolius, each occurring in different ecogeographic categories and displaying different phenotypes that may be understood as the adaptation response to these ecological characteristics. Using a similar approach, Ramírez-Villegas et al. (2010) performed a principal component analysis with 19 bioclimatic variables. They took the first two components and divided each into 20 different classes to compare the potential coverage of each species with the germplasm coverage and then assigned numerical scores according to the level of ecological representativeness in germplasm facilities.
Ecogeographic data is useful for determining the habitat requirements of a particular group of plant species and for understanding sympatric distributions of taxa within a genepool. This latter is illustrated in figure 41.7, where a selection of the wild relatives of cultivated tomato (section Lycopersicoides) is grouped according to their bioclimatic requirements. Solanum galapagense (orange polygon) and S. cheesmaniae (aquamarine polygon) are species occurring specifically in the Galapagos Islands (Ecuador). Their niche characteristics diverge from most of the other species in the section, as reflected in the graph. In the case of S. chilense (yellow polygon), part of its habitat requirement coincides with most of the section but a large part also gravitates towards PC1, suggesting a probable adaptation to ecological conditions that is not seen in the rest of the species.
To obtain the most comprehensive view of a taxon’s ecogeographic diversity, data should be collated from herbaria and genebanks (see chapter 14 for a detailed discussion). Herbarium data can be collected from online sources such as GBIF (http://data.gbif.org), personal visits to herbaria, inventories and literature reviews. While germplasm passport data can be obtained from sources such as GENESYS (www.genesys-pgr.org), which brings together information from the germplasm banks in trust with the members of the Consortium of International Agricultural Research Centers (http://singer.cgiar.org), the European ex situ collections (EURISCO, http://eurisco.ecpgr.org) and the plant germplasm system of the United States (www.ars-grin.gov/npgs/searchgrin.html).
Ecogeography is also useful for “predictive characterization”, proposing inferences based on ecological adaptations and the potential identification of desirable traits for adaptation to abiotic and biotic conditions of interest for breeders (such as resistance to insect pests). A specific application of predictive characterization is focused identification of germplasm strategy (FIGS) (see www.figstraitmine.org). This approach combines the information available on climate and ecogeography, species distribution and the distribution of a particular trait of interest (such as resistance to pests or diseases) in order to create environmental profiles of the habitats in which a given population (genotype) might have evolved. FIGS has been used to successfully identify seven new alleles for resistance to powdery mildew (genePm3) from an initial number of 16,089 wheat accessions (see Bhullar et al., 2009). The use of the FIGS methodology can thus aid breeders in identifying the in situ populations or ex situ accessions of crop landraces or wild relatives most likely to contain the traits of interest (MacKay and Street, 2004).
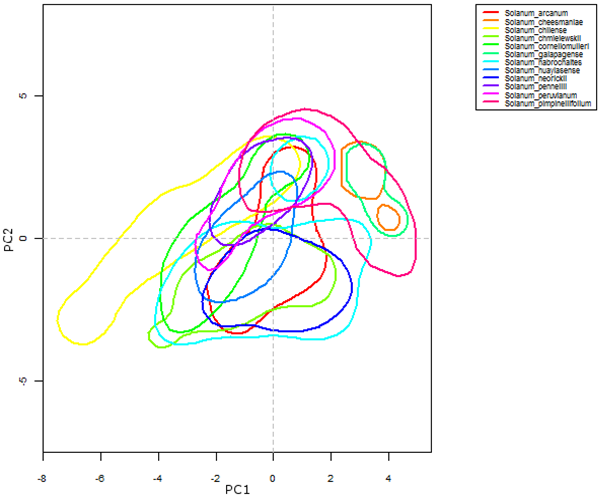 |
|
Figure 41.7: Kernel-density plot of the first two dimensions of an assessment based on variables derived from temperature and precipitation, for the section Lycopersicoides, genus Solanum |
Threat assessment
This is an important facet of gap analysis, because it facilitates the relative assessment of conservation priorities: those taxa most threatened will have a higher conservation priority than those less threatened.
Threat assessment is now routinely carried out through the application of the IUCN Red List Categories Version 3.1 (IUCN, 2001). Using associated data from herbaria or genebank accessions as a basis for the assessment, the most likely criteria to be used are criterion B (geographic range in the form of either extent of occurrence or area of occupancy) and D (very small or restricted population). Each year more taxa are included in global, regional and national Red Data lists, but until recently only a relatively small number of plant taxa (and particularly CWR taxa) had been assessed.
Recently, a project funded by the European Community specifically undertook an IUCN Red List assessment for priority European CWR diversity (Bilz et al., 2011; Kell et al., 2012). The CWR species were selected on the basis of being native to Europe, the economic importance of their related crop, their relative relationship to the crop (i.e., ease of trait transfer to the crop) and their inclusion on Annex I of the International Treaty on Plant Genetic Resources for Food and Agriculture (“the Treaty”). The final list of CWR species to be assessed comprised 591 species in 25 crop genepools/groups, 188 of which were endemic to Europe. However, 20 were subsequently assessed as “Not Applicable”, either due to their marginal occurrence in Europe or because they were introduced to Europe after 1500 AD. The status of the remaining 571 species was assessed at two regional levels: geographical Europe (572 species) and the 27 EU member states. At the European level, 313 (55%) were assessed as “Least Concern”, 166 (29%) as “Data Deficient”, 26 (5%) as “Near Threatened”, 22 (4%) as “Vulnerable”, 25 (4%) as “Endangered” and 19 (3%) as “Critically Endangered”. The priority in Europe would therefore be to focus attention on the 66 “Critically Endangered”, “Endangered” and “Vulnerable” species. This, it is hoped, will prove a useful resource for Europe, but the lack of population data is likely to remain a limitation in wider IUCN Red List assessments in other regions.
In the absence of sufficiently detailed population data to undertake an IUCN Red List assessment, a relatively large ecogeographic dataset can be used to make a more tentative threat assessment. Maxted et al. (2005) proposed and applied a technique referred to as taxon vulnerability assessment in situations where there was insufficient data to permit a formal IUCN Red Listing. Vulnerability to a loss of genetic diversity (and even extinction) can be assessed by compounding seven criteria as follows:
1. Rarity is estimated from the total number of herbarium specimens and genebank accessions of each taxon in the ecogeographic database. It is assumed that in most cases this will provide a true indicator of actual occurrence, unless there is evidence to the contrary or the taxon is cultivated or very rare, both of which cases can lead to relative over-sampling by collectors.
2. Distributional range is calculated by taking a given radius around each collecting locality and then merging the resulting circles, providing an approximation of the overall species range using the methodology described by Hijmans and Spooner (2001).
3. Representation in ex situ collections compared to herbarium collections can provide a relative estimate of whether a species’ genepool is sufficiently sampled ex situ.
4. The relative geographic coverage of ex situ collections is compared to the geographic breadth, based on ex situ conserved accessions and herbarium samples.
5. Intra-species coverage of ex situ collections can be used comparatively for species that have multiple infra-specific categories to estimate if each infra-specific taxon is adequately represented in ex situ collections.
6. The usage potential of a species is particularly relevant for the conservation of plant genetic resources, where there will be a particular incentive for conserving those species with the highest use potential. It might also be the case that species with high use potential are more likely to be threatened due to excessive utilization.
7. An assessment of taxon extinction can be estimated by applying Solow’s equation (Solow, 1993) as proposed by Burgman et al. (1995), which uses a combination of collection timing, frequency and specimen numbers.
Each of these seven criteria is assessed for each species, and a numerical score is recorded. These are then summed to establish relative taxon vulnerability.
Assessment of current conservation strategies
The diversity occurring naturally in situ can be compared to the diversity currently conserved in order to assess the efficiency of both in situ and ex situ conservation techniques and so identify the weaknesses (gaps).
Assessment of in situ conservation
Within the context of plant conservation, the definition of in situ conservation provided by the Convention on Biological Diversity (CBD) (1992) includes two distinct conservation techniques: protected area (genetic reserve) conservation for wild species and on-farm conservation in the case of traditional crop varieties, widely known as landraces. Genetic reserve conservation maintains wild species in their natural surroundings, usually within an existing protected area where the site has been selected and is managed and monitored to maintain the genetic diversity of the target taxa.
-
Genetic reserve/protected area assessment: This involves a review of existing protected areas and the species within them that are being actively managed for conservation. As few centralized databases detail which species are being actively conserved in the world’s protected areas, obtaining detailed knowledge of the protected areas in the target area is likely to involve contacting the managers of these areas to ascertain if particular species are present and being actively managed and monitored. It is increasingly possible to use geographic information system (GIS) techniques to compare the protected area spatial layers from the World Database of Protected Areas (http://protectedplanet.net) with species distributional data to predict which priority species are found in which protected areas. But, having matched these datasets, there would still be a need to contact the managers of specific protected areas in order to confirm that the species predicted to be present are indeed present.
-
On-farm conservation assessment: Similarly, the on-farm conservation of landraces requires reviewing existing on-farm conservation projects and the crop species included. The review of on-farm conservation is likely to be simpler than the review of protected areas due to the more limited number of on-farm conservation projects and the relative ease of discovering which crop species are included.
In terms of assessing in situ conservation, it must be admitted that there are so few locations where there is currently any effective in situ conservation of agrobiodiversity, the sites where natural target-taxon diversity is located are almost always likely to be those sites where in situ conservation is recommended.
Assessment of ex situ conservation
To assess the gross completeness of material conserved ex situ, a comparison should be made between the unique samples recorded from herbaria versus those from genebanks, although these sources of information can become outdated (Bettencourt et al., 1989). Other sources of material that is currently being conserved can be obtained from botanic gardens, as well as from national and international catalogues, databases and web sites. Herbarium data can be collected from online sources (such as GBIF, http://data.gbif.org), personal visits to herbaria, inventories and literature reviews. Germplasm passport data can also be obtained from sources like GENESYS (www.genesys-pgr.org), which brings together information from the germplasm banks in trust with the members of the Consortium of International Agricultural Research Centers (http://singer.cgiar.org), the European ex situ collections (http://eurisco.ecpgr.org) and the plant germplasm system of the United States of America (www.ars-grin.gov/npgs/searchgrin.html). Other initiatives, such as that of the European Native Seed Conservation Network are now in the process of providing additional wild-species genebank accessions associated with botanic gardens through the European Native Seed Conservation Network Database (ENSCOBASE) (http://enscobase.maich.gr). Depending on the extent and scope of the study, local sources could also be considered for obtaining data. As an illustration, figure 41.8 shows the sampling deficiencies for the crop wild relatives of tomato. The bold line in the graph represents the average representativeness of the dataset used, and the dashed line is the total representativeness. Taxa located below the bold line have fewer samples in ex situ holdings compared with the number of samples in herbaria (ex situ sampling deficient). In this case, the “gap” under-collected species are S. habrochaites, S. corneliomulleri, S. juglandifolium and S. cheesmaniae.
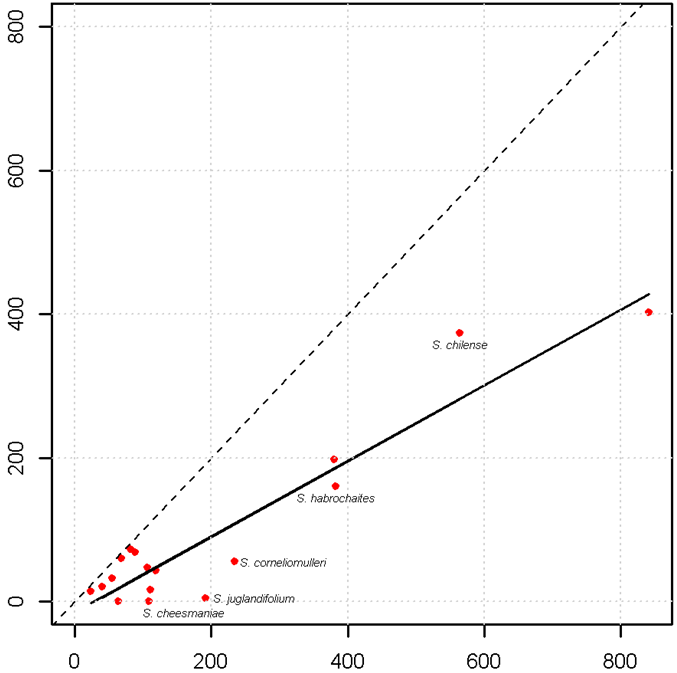 |
|
Figure 41.8: Number of genebank samples of the wild relatives of tomato (Solanum lycopersicum) versus total samples (total is calculated by adding germplasm and herbarium samples) |
When using ecogeographic distribution as a proxy for data on genetic diversity, the ideal ex situ collection would contain samples from geographically diverse sites spread throughout the entire range of distribution of the crop or species. Such a proxy can be calculated using herbarium and genebank collection data, and the circular area statistic (CA) (Hijmans et al., 2001). CA is calculated by assigning a circle of set radius around each collection, and the total area of those circles for all collections is calculated (counting overlapping regions only once). For collections that are geographically highly concentrated, the CA is relatively low compared to a set of collections that are geographically distributed over a wide region (due to greater overlap in clumped collections). This statistic can be used to compare germplasm collections with all collections (germplasm and herbarium collection data) in order to identify how geographically representative the germplasm collection is. Germplasm collections whose geographic distribution is representative should have a CA statistic similar to that of the entire collection. Conversely, germplasm collections where the geographic distribution is poorly represented would have a low CA compared to the entire collection, due to concentrated ex situ collecting in regions representing only a subset of the wider distribution of the species.
Ramírez-Villegas et al. (2010) used a quantitative approach to determine the requirements for ex situ conservation of the genus Phaseolus, assessing three concepts per taxon level: sampling representativeness, geographical and environmental coverage. Sampling representativeness consists of a comparison between the total number of populations sampled and those sampled as genebank accessions. This is referred to as the sampling representativeness score (SRS). Ramírez-Villegas et al. estimated geographical coverage by comparing the potential distribution of the taxon with the circular statistic (CA) within a 50km radius of the germplasm samples, this value is stored as the geographic representativeness score (GRS). The environmental coverage representativeness (or environmental representativeness score, ERS) is estimated by overlapping the whole geographic extent of the taxon with the two principal components of 19 bioclimatic variables and the corresponding germplasm accessions. The final priority score (FPS) is calculated by averaging SRS, GRS and ERS. The lower the value of FPS, the higher the priority for conserving the taxon. Additionally, Ramírez-Villegas et al. (2010) validated the priority for the conservation list produced after applying this methodology by comparing it with the scores given by a recognized expert on Phaseolus (Dr Daniel Debouck), obtaining a high correspondence with his priorities for conservation (reported as rho=0.788).
Reformulation of conservation strategy
An assessment of the effectiveness of current conservation coverage in relation to natural in situ diversity identifies the element of diversity that is under-conserved, i.e. the “gaps” in the existing conservation strategy, and helps refocus the strategy to conserve the maximum diversity and to fill these gaps. The revised priorities are likely to require complementary in situ and ex situ conservation actions to ensure the comprehensive conservation of the target taxon’s genepool.
In situ conservation priorities
Genetic reserve/protected area
The location and establishment of genetic reserves should be based on the gap analysis outlining the most appropriate location for the genetic reserve. Genetic reserves will commonly be established within existing protected areas because (a) these sites already have an associated long-term conservation ethos and are less prone to hasty management changes associated with private land or roadsides where conservation value and sustainability is not a consideration, (b) it is relatively easy to amend the existing site management to facilitate genetic conservation of CWR species and (c) it means that creating new conservation sites can be avoided, thereby also avoiding the possibly prohibitive cost of acquiring land that had not previously been managed for conservation (Maxted et al., 2008c). Therefore, the simplest way forward in economic and political terms is to locate genetic reserves in existing protected areas, such as national parks or heritage sites. This is likely to provide some benefit to local people and so is also likely to gain their support when participatory approaches are employed.
On-farm conservation priorities
Traditional crop or landrace richness can be used to indicate priority sites for in situ conservation for the on-farm conservation of landraces. Areas that have a high concentration of landraces (either of multiple or individual crops) are desired for on-farm conservation projects.
Ex situ conservation priorities
Species and areas within a species range that have been under-sampled in ex situ collections are highlighted as priorities for future collection and subsequent ex situ conservation.
Future challenges/needs/gaps
In the medium term, the understanding of patterns of genetic diversity and their relation to elements of the landscape will allow us to recognize in more detail where the areas of allele richness and uniqueness are, and if there is a correlation with the local environment, thus confirming the validity of using subrogates of diversity such as ecogeographic methods. These analyses could be performed in genepools or genebank collections that have been largely characterized at the molecular level. Increasing interest in (and need for) conserving key plant species should be prioritized using a gap analysis approach, so that the allocation of resources will target the most important species (whether for food, forage, breeding, cultural matters or any other ecosystem service). And finally, there are different types of refined and structured methodologies for gap analysis in the conservation area. Those methodologies based on computer scripts should use open-source coding and should be user friendly, thereby encouraging their use and avoiding the limitations that licensed software might impose to users with restricted budgets.
Two key global initiatives are currently underway and both have at their heart the gap analysis of agrobiodiversity. The Global Crop Diversity Trust has launched the project on Adapting Agriculture to Climate Change (Guarino and Lobell, 2011), which, in part, aims to systematically sample priority CWR taxa and ensure that the germplasm is stored ex situ in the country of origin, the Millennium Seed Bank and the Svalbard Global Seed Vault. Alongside this, during the 13th regular session of the Commission on Genetic Resources for Food and Agriculture, held in 2011, the FAO was requested to elaborate on the means and opportunities for establishing a global network for in situ conservation and on-farm management of plant genetic resources for food and agriculture in coordination with the Treaty, the Global Strategy for Plant Conservation of the CBD and other relevant stakeholders. Both initiatives use as their starting point the Harlan and de Wet Global Priority Checklist of CWR Taxa and ecogeographic datasets for the included taxa to which the basic gap analysis methodology described above is applied. With so much attention currently being paid to the application of the gap analysis methodology, it should come as no surprise if the methodology itself evolves rapidly, so those wishing to undertake gap analysis should keep abreast of these methodological developments.
Conclusion
Although gap analysis is a fairly recent tool for the conservation of plant genetic resources, it is proving to be an effective instrument in the planning of complementary conservation strategies that encompass both in situ and ex situ applications. It has also shown how the study of the passport collection data of herbarium and germplasm accessions, coupled with ecogeographic analyses, can quantify the completeness of current in situ and ex situ conservation actions and identify gaps in conservation diversity at both the taxon and geographic level, which, in turn, helps in the prioritization of future conservation actions.
This basic methodology has been successfully applied to assist the development of national conservation strategies for CWR diversity in the UK (Maxted et al., 2007) and Israel (Barazani et al., 2008), and, at a monographic scale, the African genus Vigna (Maxted et al., 2005), the FAO CWR project (Maxted and Kell, 2009) and the CIAT-IRRI-Bioversity International GapAnalysis project, showing that the methodology is sufficiently robust to yield useful results that can bolster conservation efficiency. If the conservation community is to meet the challenge of the CBD Strategic Plan “Target 13” by 2020, the status of the genetic diversity of crop and livestock agricultural ecosystems and of wild relatives will have to be improved (CBD, 2010) and tools such as the gap analysis methodology described above are likely to prove essential.
Back to list of chapters on collecting
References and further reading
Arponen A, Heikkinen R, Thomas CD, Moilanen A. 2005. The value of biodiversity in reserve selection: Representation, species weighting and benefit functions. Conservation Biology 19: 2009–2014.
Balmford A. 2003. Conservation planning in the real world: South Africa shows the way. Trends in Ecology and Evolution 18:435–438.
Barazani O, Perevolotsky A, Hadas R. 2008. A problem of the rich: Prioritizing local plant genetic resources for ex situ conservation in Israel. Biological Conservation 141: 596–600.
Bettencourt E, Konopka J, Damania AB. 1989. Directory of Crop Germplasm Collections. 1. Food LEGUMES. International Board for Plant Genetic Resources, Rome.
Bhullar NK, Street K, Mackay M, Yahiaoui N, Keller B. 2009. Unlocking wheat genetic resources for the molecular identification of previously undescribed functional alleles at the Pm3 resistance locus. Proceedings of the National Academy of Sciences of the United States of America 106: 9519–9525.
Bilz M, Kell SP, Maxted N, Lansdown RV. 2011. European Red List of Vascular Plants. Publications Office of the European Union, Luxembourg.
Brooks TM, Bakarr MI, Boucher T, Da Fonseca GAB, Hilton-Taylor C, Hoekstra JM. 2004. Coverage provided by the global protected area system: Is it enough? Bioscience 54:1081–1091.
Burgman A, Grimson RC, Ferson S. 1995. Inferring threat from scientific collections. Conservation Biology 9:923–929.
Burley FW. 1988. Monitoring biological diversity for setting priorities in conservation. In: Wilson EO, Peter FM, editors. Biodiversity. National Academy Press, Washington DC. pp. 227–230
CBD. 1992. Convention on Biological Diversity: Text and Annexes. Secretariat of the Convention on Biological Diversity, Montreal.
CBD. 2010. Strategic Plan for Biodiversity 2011–2020, Including Aichi Biodiversity Targets. Secretariat of the Convention on Biological Diversity, Montreal.
Dietz RW, Czech B. 2005. Conservation deficits for the continental United States: An ecosystem gap analysis. Conservation Biology 19:1478–1487.
FAO. 2009. The Second Report on the State of the World’s Plant Genetic Resources for Food and Agriculture. Food and Agriculture Organization of the United Nations, Rome.
Ferguson ME, Ford-Lloyd BV, Robertson LD, Maxted N, Newbury HJ. 1998. Mapping the geographical distribution of genetic variation in the genus Lens for the enhanced conservation of plant genetic diversity. Molecular Ecology 7:1743–1755.
Guarino L, Lobell DB. 2011. A walk on the wild side. Nature Climate Change 1:374–375.
Guarino L, Maxted N, Chiwona EA. 2006. A methodological model for ecogeographic surveys of crops. IPGRI Technical Bulletin No. 9. International Plant Genetic Resources Institute, Rome.
Hijmans R, Spooner D. 2001. Geographic distribution of wild potato species. American Journal of Botany 88:2101–2112.
Hijmans RJ, Cruz M, Rojas E, Guarino L. 2001. DIVA-GIS Manual. Version 1.4. A Geographic Information System for the Management and Analysis of Genetic Resources Data. International Potato Center, Lima, Peru.
IUCN. 2001. IUCN Red List Categories Version 3.1. IUCN Species Survival Commission. International Union for Conservation of Nature and Natural Resources, Gland, Switzerland.
Kell SP, Maxted N, Bilz M. 2012. European crop wild relative threat assessment: Knowledge gained and lessons learnt. In: Maxted N, Dulloo ME, Ford-Lloyd BV, Frese L, Iriondo JM, Pinheiro de Carvalho MAA, editors. Agrobiodiversity Conservation: Securing the Diversity of Crop Wild Relatives and Landraces. CAB International, Wallingford, UK. pp. 218–242.
Lipow SR, Vance-Borland K, St. Clair JB, Henderson J, McCain C. 2004. Gap analysis of conserved genetic resources for forest trees. Conservation Biology 18(2):412–423.
Mackay MC, Street K. 2004. Focused identification of germplasm strategy—FIGS. In: Black CK, Panozzo JF, Rebetzke GJ, editors. Cereals 2004. Proceedings of the 54th Australian Cereal Chemistry Conference and the 11th Wheat Breeders’ Assembly, 21–24 September 2004, Canberra, Australian Capital Territory. Royal Australian Chemical Institute, Melbourne. pp. 138–141.
Margules CR. 1989. Introduction to some Australian developments in conservation evaluation. Biological Conservation 50:1–11.
Margules CR, Pressey RL. 2000. Systematic conservation planning. Nature 405:243–253.
Margules CR, Nicholls AO, Pressey RL. 1988. Selecting networks of reserves to maximise biological diversity. Biological Conservation 43:63–76.
Maxted N, Guarino L. 2003. Planning plant genetic conservation. In: Smith RD, Dickie JB, Linington SH, Pritchard HW, Probert RJ, editors. Seed Conservation: Turning Science into Practice. Royal Botanic Gardens, Kew, UK. pp. 37–78.
Maxted N, Kell SP. 2009. Establishment of a global network for the in situ conservation of crop wild relatives: Status and needs. FAO Consultancy Report. Food and Agriculture Organization of the United Nations, Rome.
Maxted N, Mabuza-Dlamini P, Moss H, Padulosi S, Jarvis A, Guarino L. 2005. An Ecogeographic Survey: African Vigna. Systematic and Ecogeographic Studies of Crop Genepools 10. International Plant Genetic Resources Institute, Rome.
Maxted N, Scholten MA, Codd R, Ford-Lloyd BV. 2007. Creation and use of a national inventory of crop wild relatives. Biological Conservation 140:142–159.
Maxted N, Dulloo E, Ford-Lloyd BV, Iriondo J, Jarvis A. 2008a. Genetic gap analysis: A tool for more effective genetic conservation assessment. Diversity and Distributions 14:1018–1030.
Maxted N, White K, Valkoun J, Konopka J, Hargreaves S. 2008b. Towards a conservation strategy for Aegilops species. Plant Genetic Resources: Characterization and Utilization 6(2):126–141.
Maxted N, Iriondo J, Dulloo E, Lane A. 2008c. Introduction: The integration of PGR conservation with protected area management. In: Iriondo JM, Maxted N, Dulloo E, editors. Plant Genetic Population Management. CAB International, Wallingford, UK. pp. 1–22.
Maxted N, Hargreaves S, Kell SP, Amri A, Street K, Shehadeh A, Piggin J, Konopka J. 2012. Temperate forage and pulse legume genetic gap analysis. Bocconea 24:5–36.
Moray C, Maxted N. 2012. Prioritising conservation of crop resources: A case study of African cowpea (Vigna unguiculata). Conservation Letters, In Press.
Parra-Quijano M, Iriondo JM, Torres E. 2012a. Improving representativeness of gene bank collections through species distribution models, gap analysis and ecogeographic maps. Biodiversity and Conservation 21(1):79–96.
Parra-Quijano M, Iriondo JM, Torres E. 2012b. Ecogeographical land characterization maps as a tool for assessing plant adaptation and their implications in agrobiodiversity studies. Genetic Resources and Crop Evolution 59(2):205–218.
Pressey RL, Nicholls AO. 1989. Efficiency in conservation evaluation: Scoring versus iterative approaches. Biological Conservation 50:199–218.
Pressey RL, Humphries CR, Vane-Wright RI, Williams PH. 1993. Beyond opportunism: Key principles for systematic reserve selection. Trends in Ecology and Evolution 8:124–128.
Ramírez-Villegas J, Khoury C, Jarvis A, Debouck DG, Guarino L. 2010. A gap analysis methodology for collecting crop gene pools: A case study with Phaseolus beans. PLoS ONE 5(10): e13497. doi:10.1371/journal.pone.0013497.
Riemann H, Ezcurra E. 2005. Plant endemism and natural protected areas in the peninsula of Baja California, Mexico. Biological Conservation 122:141–150.
Solow AR. 1993. Inferring extinction from sighting data. Ecology 74:962–964.
van Zonneveld M, Scheldeman X, Escribano P, Viruel MA, van Damme P, Garcia W, Tapia C, Romero J, Sigueñas M, Hormaza JI. 2012. Mapping genetic diversity of cherimoya (Annona cherimola Mill.): Application of spatial analysis for conservation and use of plant genetic resources. PLoS ONE 7(1): e29845. doi:10.1371/journal.pone.0029845.
Venevsky I, Venevskaya S. 2005. Species-energy theory for vascular plants and application of this theory for mapping of national biodiversity hotspots. In: Macroecological tools for Global Change Research. Virtual Institute for Macroecology, Institute for Climate Impact Research, Potsdam. pp. 138–139.
Vincent H, Wiersema J, Dobbie S, Kell SP, Fielder H, Castañeda Alvarez NP, Guarino L, Eastwood R, León B, Maxted N. 2012. A prioritised crop wild relative inventory as a first step to help underpin global food security. Proceedings of the Royal Society B. In preparation.
Whitehouse K. 2011. An ecogeographic and GIS analysis of cereals: Avena, Aegilops, Hordeum, Secale and Triticum. Unpublished Master’s Thesis. University of Birmingham, Birmingham, UK.
Biodiversity and WorldMap: www.nhm.ac.uk/research-curation/research/projects/worldmap/index.html
Botanic Gardens Conservation International (BCGI): www.bgci.org
CIAT-IRRI-Bioversity International GapAnalysis project, ex situ gap analysis results of 13 crop gene pools: http://gisweb.ciat.cgiar.org/gapanalysis
Consortium of International Agricultural Research Centers (SINGER): http://singer.cgiar.org
EURISCO, European ex situ collections: http://eurisco.ecpgr.org
European Native Seed Conservation Network (ENSCOBASE): http://enscobase.maich.gr
FAOSTAT, agricultural statistics and data: www.faostat.fao.org
GBIF, global biodiversity data: http://data.gbif.org
GENESYS, global database of major ex situ genebank holdings: www.genesys-pgr.org
GlobeCover, European Space Agency global land cover map: http://ionia1.esrin.esa.int
Harlan and de Wet Global Priority Checklist of CWR Taxa: www.cwrdiversity.org
Harmonized World Soil Database v 1.2: www.iiasa.ac.at/Research/LUC/External-World-soil-database/HTML
International Panel on Climate Change (IPCC), climate-change forecasts: www.ipcc-data.org/ddc_climscen.html
IUCN Red List, database of extinction threat assessments: www.iucnredlist.org
JSTOR Herbaria: http://plants.jstor.org
STRM 90m Digital Elevation Data: http://srtm.csi.cgiar.org/index.asp
The Plant List, working list of all known plant species: www.theplantlist.org
Tropicos®, herbarium resources, Missouri Botanical Gardens, USA: www.tropicos.org
UNEP WCMC World Database of Protected Areas: www.protectedplanet.net
US Genetic Resources Information Network (GRIN): www.ars-grin.gov/npgs/acc/acc_queries.html
World Database of Protected Areas: http://protectedplanet.net
Worldclim Global Climate Layers, 1km resolution grids of climate and derived bioclimate datasets: www.worldclim.org
More Articles...
- Chapter 3. An introduction to plant germplasm exploration and collecting: planning, methods and procedures, follow-up
- Chapter 28: Processing of germplasm, associated material and data
- Chapter 18: Collecting plant genetic resources and documenting associated indigenous knowledge in the field: a participatory approach
- Chapter 5: Basic sampling strategies: theory and practice
Subcategories
-
main
- Article Count:
- 1
-
Collecting
- Article Count:
- 31
-
Acquisition/Registration
- Article Count:
- 2
-
Sample processing
- Article Count:
- 1
-
Quality testing
What is quality testing?
The quality testing of seeds or plant materials assures that the materials to be conserved are in good conditions, i.e. can be grown again (viable) and are free of external contaminants (pests and diseases) and external genes (artificially produced genes). They are composed by three major aspects:
- Viability testing
- Plant health
- Transgenes.JPG)
The quality of seed can be tested with a germination test
- Article Count:
- 5
-
Methods of conservation
- Article Count:
- 2
-
Cold storage
- Article Count:
- 1
-
Tissue culture
- Article Count:
- 1
-
Cryopreservation
- Article Count:
- 1
-
Molecular
- Article Count:
- 1
-
In field conservation
- Article Count:
- 1
-
Characterization
- Article Count:
- 1
-
Regeneration
What is Regeneration?
Regeneration is the renewal of germplasm accessions by sowing seeds or planting vegetative materials and harvesting the seeds or plant materials which will posses the same characteristics as the original population.
Germplasm regeneration is the most critical operation in genebank management, because it involves risks to the genetic integrity of germplasm accessions due to selection pressures, out-crossing, mechanical mixtures and other factors. The risk of genetic integrity loss is usually high when regenerating genetically heterogeneous germplasm accessions. Germplasm regeneration is also very expensive..JPG)
Regeneration on fields
Why should germplasm be regenerated?
Germplasm is regenerated for the following purposes:
1. To increase the initial seeds or plant materials
In new collections or materials received as donations, the quantity of seeds or plant materials received by the genebank is often insufficient for direct conservation. Seeds or plant materials may also be of poor quality due to low viability or infection. All these materials require regeneration. Newly acquired germplasm of foreign origin may need to be initially regenerated under containment or in an isolation area under the supervision of the national phytosanitary authorities.
2. To replenishing seed stocks or plant materials in active and base collections
Increase seed stocks or plant materials of accessions that have:
- Low viability identified during periodic monitoring;
- Insufficient stocks for distribution or conservation.
Active collections should be regenerated from original seeds or plant materials in a base collection; this is particularly important for out-breeding species. Using seeds from an active collection for up to three regeneration cycles before returning to the original seeds or plant materials (base collection) is also acceptable (FAO/IPGRI 1994).
Base collections should normally be regenerated using the residual seed or plant materials from the same sample.How is it done?
If possible, regenerate germplasm in the ecological region of its origin. Alternatively, seek an environment that does not select some genotypes in preference to others in a population.
If no suitable site is found, seek collaboration with an institute that can provide a suitable site or regenerate in a controlled environment such as a growth room.
Examine the biotic environment in the context of prior information about the plants and past experience - an inappropriate biotic environment can be detrimental to plants, seed or propagation materials quality and the genetic integrity of an accession.Meeting special requirements
There may be special requirements for regeneration of accessions with special traits that breeders and researchers use frequently—such as high-yielding, pest-and disease-resistant accessions and genetic stocks — or if there are insufficient seeds for safety duplication and repatriation.
The following factors when regenerating germplasm accessions must be consider:- Suitability of environment to minimize natural selection;
- Special requirements, if any, to break dormancy and stimulate germination (such as scarification);
- Correct spacing for optimum seed set; and
- Breeding system of the plant and need for controlled pollination or isolation..JPG)
Regeneration in a protected environment
When should it be done?
It should be done when either the quantity and/or the quality of a particular seed or plant material are not sufficient in a genebank.
The regeneration of accessions that have inadequate quality (low viability) should take priority over that of accessions with inadequate numbers of seeds or planting materials.
The regeneration of accessions in base collections should take priority over regenerating those in active collections.
- Article Count:
- 1
-
Dissemination
- Article Count:
- 1
-
Safety duplication
- Article Count:
- 1
-
Information/Documentation
- Article Count:
- 1
-
List of equipment and supplies
- Article Count:
- 1